by Bill Zoellick
Last fall, students working with Ed Lindsey and Chuck Neeley at Old Town High School collected water samples from taps in about 30 buildings around Old Town, Maine, as part of our “Crowd the Tap Maine” project. They have begun analyzing and displaying the data, using the Anecdata and Tuva platforms. Though the students will need some more time to make sense out of the information in their own way, I wanted to provide some examples of what is possible. Over time we will figure out how “possible” relates to “educationally useful.”
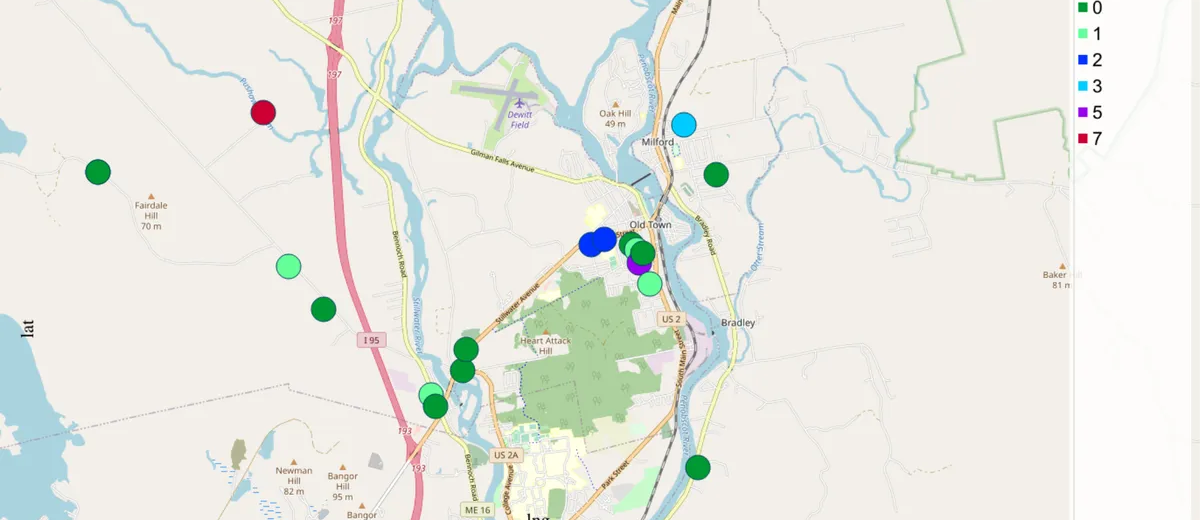
For example: maps. Teachers have told us that many students have only a weak conception of their community as a physical place with hills, rivers, quarries, and other features that shape how the community has developed. One of the reasons that we initiated the Crowd the Tap project is that it provides students with opportunities to think about their communities geographically and spatially. Seeing the data on a map is an important way to stimulate conversations that deepen students’ thinking about their place.
Read more at CSI-Maine.org.