by Tessa Houston
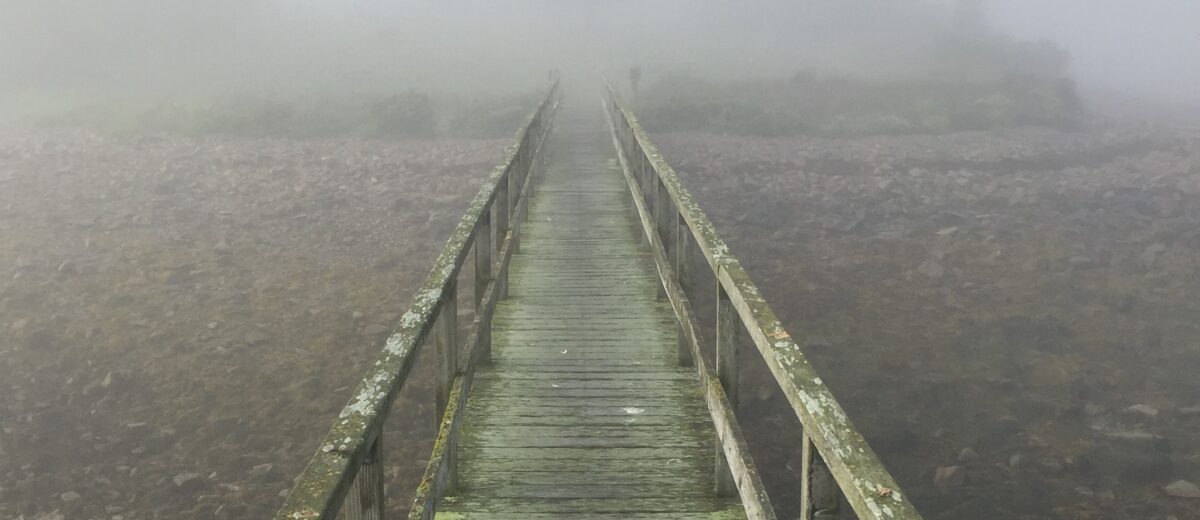
I spent summers at my grandparents’ house on Southport Island. I remember waking up and seeing a wall of thick, almost solid-looking fog outside the window. There were times I could not see even the outline of the shore across the narrow cove they lived on. The feelings this created were mixed, as the fog would add a calmness and eeriness to the landscape, but would also inspire excitement as I looked forward to the fun “foggy day” activities at my sailing camp. In this way, the fog would shift my daily activities, much as it has shifted the activities of Mainers for over 200 years.
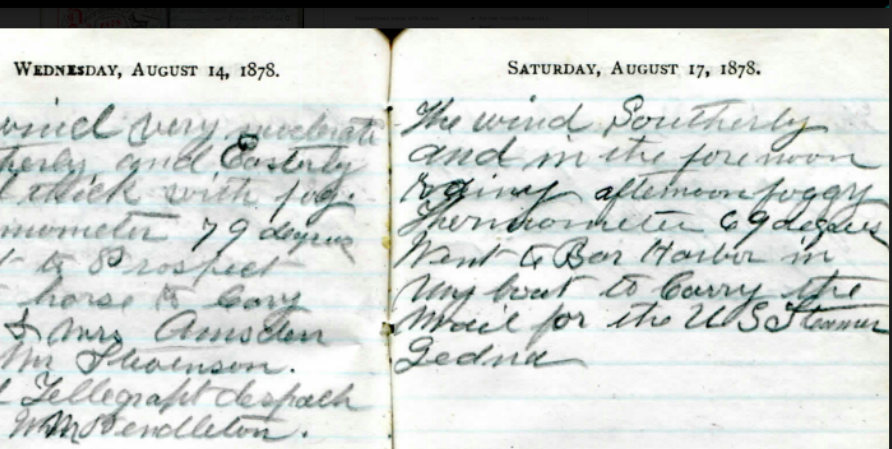
On days “thick with fog,” for example, Freeland Rosebrook Bunker, a justice of the peace living in Winter Harbor, would usually do tasks around the home, rather than venturing out by boat to help his neighbors or transport passengers around the region with his ferry. If he were on one of his many journeys to Boston or New York, Bunker would frequently lay at anchor in harbors on foggy days. In the days before GPS, fog could turn quick journeys by sea into dangerous, and potentially lethal, trips.
Fog has many significant ecological impacts in addition to its social impacts. The presence of coastal fog can lower air temperatures, increase humidity, and add water to coastal ecosystems. In a 2010 study, researchers found the frequency of foggy days has been decreasing on the Pacific Coast of California, and this decrease could result in increased temperatures and drought for coastal ecosystems that rely on the extra moisture fog brings. Because of these possible negative impacts of a decrease in the frequency of foggy days, it is important to understand if this is phenomenon is local to the West Coast, or if it could also be occurring in, and impacting, Maine’s coastal ecosystems.
Throughout my research on how the frequency of foggy days has changed through time in the Acadia region, I have experienced both the kindness of strangers and the vast range of sources available and helpful for this project. In looking for mentions of fog, I read through the Champlain Society logbooks from the 1880s and meteorological records from the 1900s, but I also reached out to airports and fishermen. Overall, I ended up using eight separate sources in compiling my information, with the potential for more data from at least three more sources in the future (see list below).
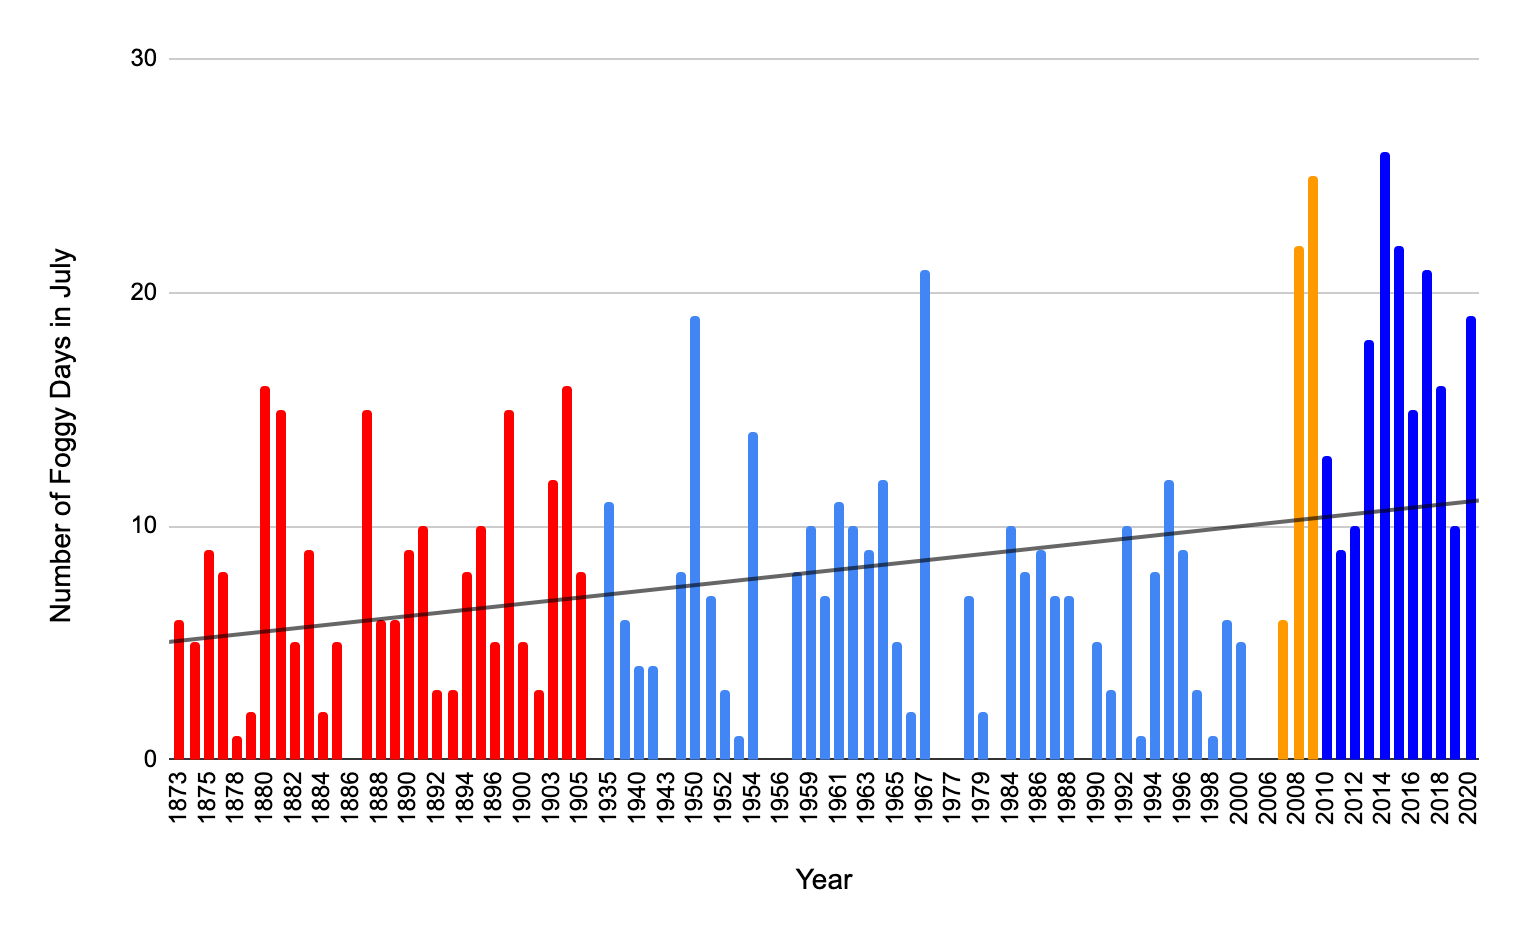
After compiling data from these various sources, historical and contemporary, I found that the frequency of foggy days appears to have increased through time as can be seen through a positive linear trendline. I chose to compare the number of foggy days in July through time due to the consistency of observations during this month and the increased number of observers, such as the Champlain Society and US Fish and Wildlife Service, who recorded data during the summer months, rather than year-round.
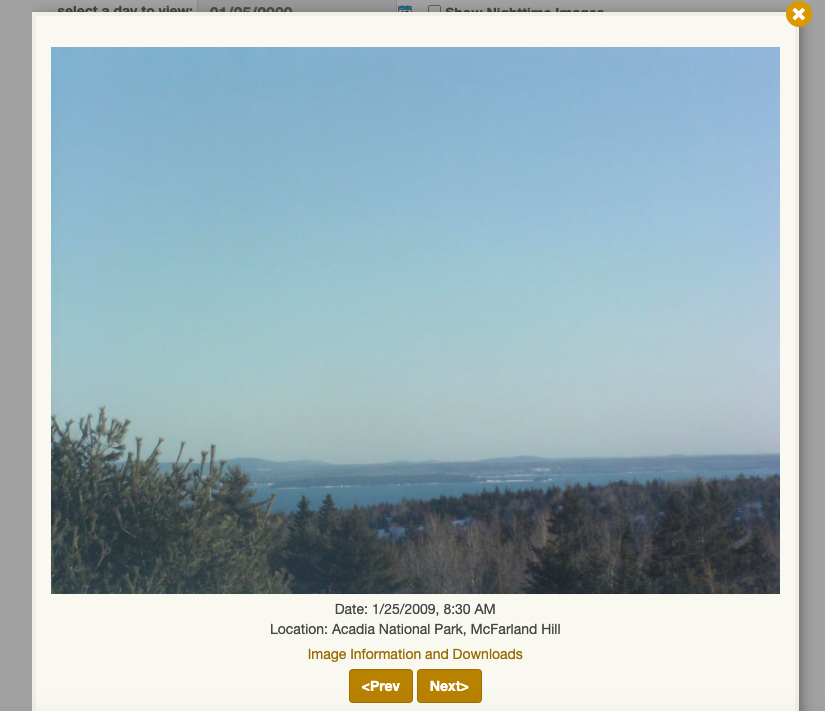
The variety of resources I used, and people I received information from, shows the complexity of doing research in the field of historical ecology. With so many different sources of information, it is important to remember the bias or fallbacks they each have. Freeland Bunker, for example, spent months away from his home in Winter Harbor traveling, and not recording the presence or absence of fog in the Acadia region. The Champlain Society only recorded observations from July through September. Observers from the 1900s through today may have looked for the presence of fog only at the time when they were actually recording their data. In contrast, the National Park Service’s air quality camera has consistently taken photos throughout the day, almost every day, since 2006, perhaps increasing the number of foggy days recorded for this time period. So while the results from this study were unexpected based on previous studies on the West Coast, it is possible that my previous examples could be an explanation for this difference or the Acadia region might just not be experiencing the same decrease in fog frequency as the West Coast is. Further research would be needed to determine this.
While doing this research I was really struck by the willingness of strangers to help me. For example, Todd Little-Siebold, a professor at College of the Atlantic, spent a chunk of time on a holiday discussing Freeland Bunker’s journals, recommending other sources to look at, and putting me in contact with people who could possibly help me. Julie Taylor, the Lead Naturalist at the Bar Harbor Whale Watch Company, also reached out to me with the possibility of her and other volunteers going through the company’s logbooks to find references to fog. I was so grateful, and surprised, that so many people were willing to go out of their way to help me during this research.

Sources for fog data:
- Champlain Society logbooks (courtesy of Schoodic Institute)
- Freeland Rosebrook Bunker journals (courtesy of Todd Little-Siebold and the Winter Harbor Historical Society)
- Cooperative observer’s meteorological record (found through IRMA)
- Record of climatological observations (found through IRMA)
- Record of river and climatological observations (found through IRMA)
- NOAA’s Climate Data Online tool – station USC00170100 (found through NOAA)
- US Fish and Wildlife Service – data from Petit Manan Island (courtesy of Linda Welch, USFWS)
- National Park Service Air Quality Webcam Network – McFarland Hill (recommended by Bill Gawley, NPS)