by Catherine Schmitt
Tides are highest (and lowest) during full and new moons, when the moon and sun – and their gravitational pull—are in alignment with Earth. Even higher (and lower) tides occur when the moon is closest in its elliptical orbit around our planet. In the fall and early winter, astronomical alignment combines with warm water and seasonal weather patterns that shift how wind, waves, and currents push water against the shore to bring us higher-than-usual high tides, or “king tides,” according to NOAA.
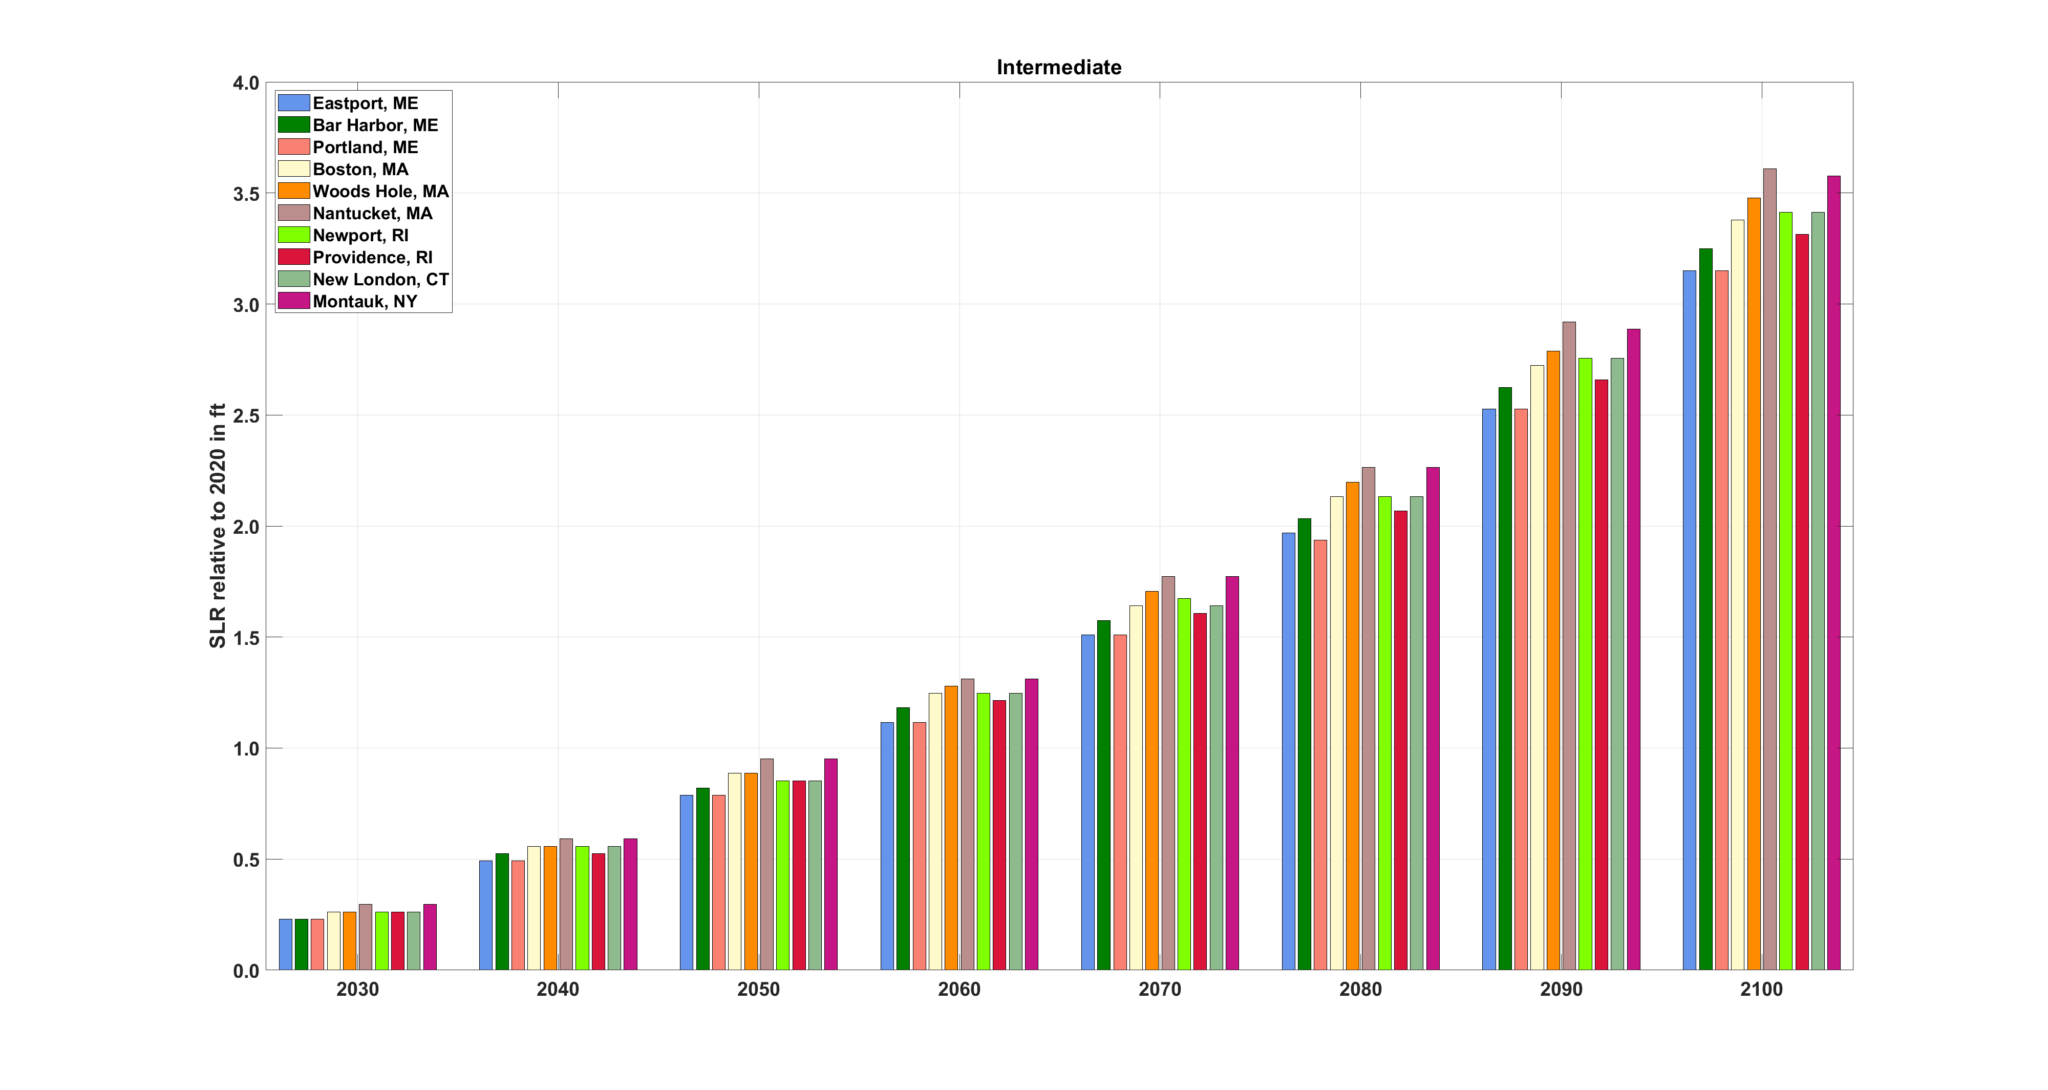
We monitor king tides because they offer an opportunity to experience higher sea levels of the future. The sea has been gradually rising in Maine since the end of the last ice age, but the rate of rise is accelerating as temperatures warm and glaciers melt. Sea level in Bar Harbor is eight inches higher than it was in 1950, and is now rising at about a tenth of an inch per year. In the next three decades, this rate could speed up to half an inch per year under the worst-case scenario of continued warming, according to the latest forecast. But what does a fraction of an inch per year really mean? King tides enable us to “ground truth” these numbers and visualize what seem to be small differences in water height.
For example, on Friday (11/25) and Saturday (11/26), the king tide at Bar Harbor will be at 12.9 feet (above mean lower low water level). The average high tide is around 11 feet. The king tide, then, lets us see what a height difference of nearly two feet means for the shoreline – it could be the difference between whether or not a road floods, a well is tainted by salt, a marsh drowns, or trees die. Monitoring high tides also helps communities prepare for future conditions—today’s “king tide” is the average high tide of the future.
Because the sea continues to rise at an accelerating rate, it is difficult if not impossible to establish baselines or averages. For example, at Bar Harbor the highest tides of the month are now always above the late twentieth-century mean of 11.37, with November 2016 showing a record king tide of 13.69 feet. Storms, of course, push water levels even higher. The highest tide at Bar Harbor was 16.21 feet during the Blizzard of ’78.
Measuring sea level rise
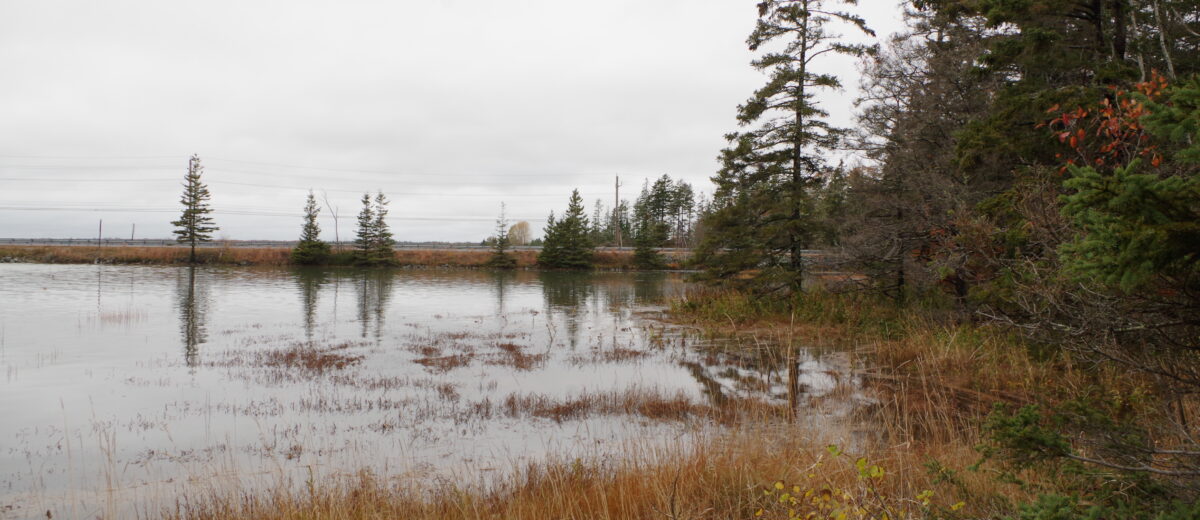
Sea level can also be measured indirectly, by studying its effects. Second Century Stewardship fellow Caitlin Littlefield is researching the narrow zone where the forest meets salt marsh. Littlefield’s preliminary analysis of satellite imagery showed a loss of “green-ness” over the last decade along forest-marsh edges, and field surveys in May 2022 revealed dead and dying trees next to several marshes in and around the park, an indication that salt water is reaching the tree roots. In some places, marsh grass appeared to be growing inside the forest.
Salt marshes persist by growing vertically as plant roots accumulate into new layers of peat and high tides deliver sediment. Without space to “migrate” salt marshes could disappear or “drown” beneath rising seas.
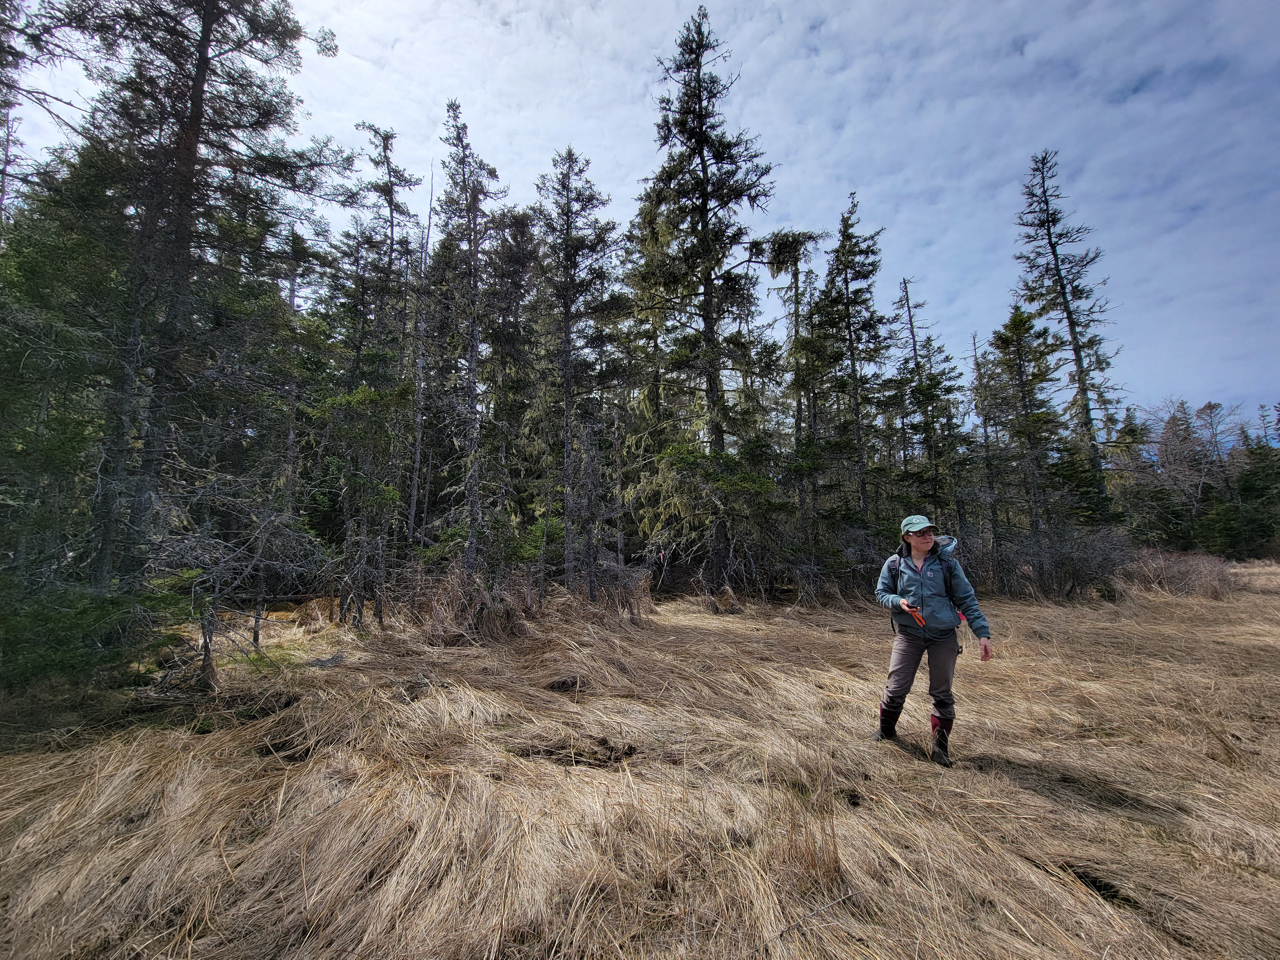
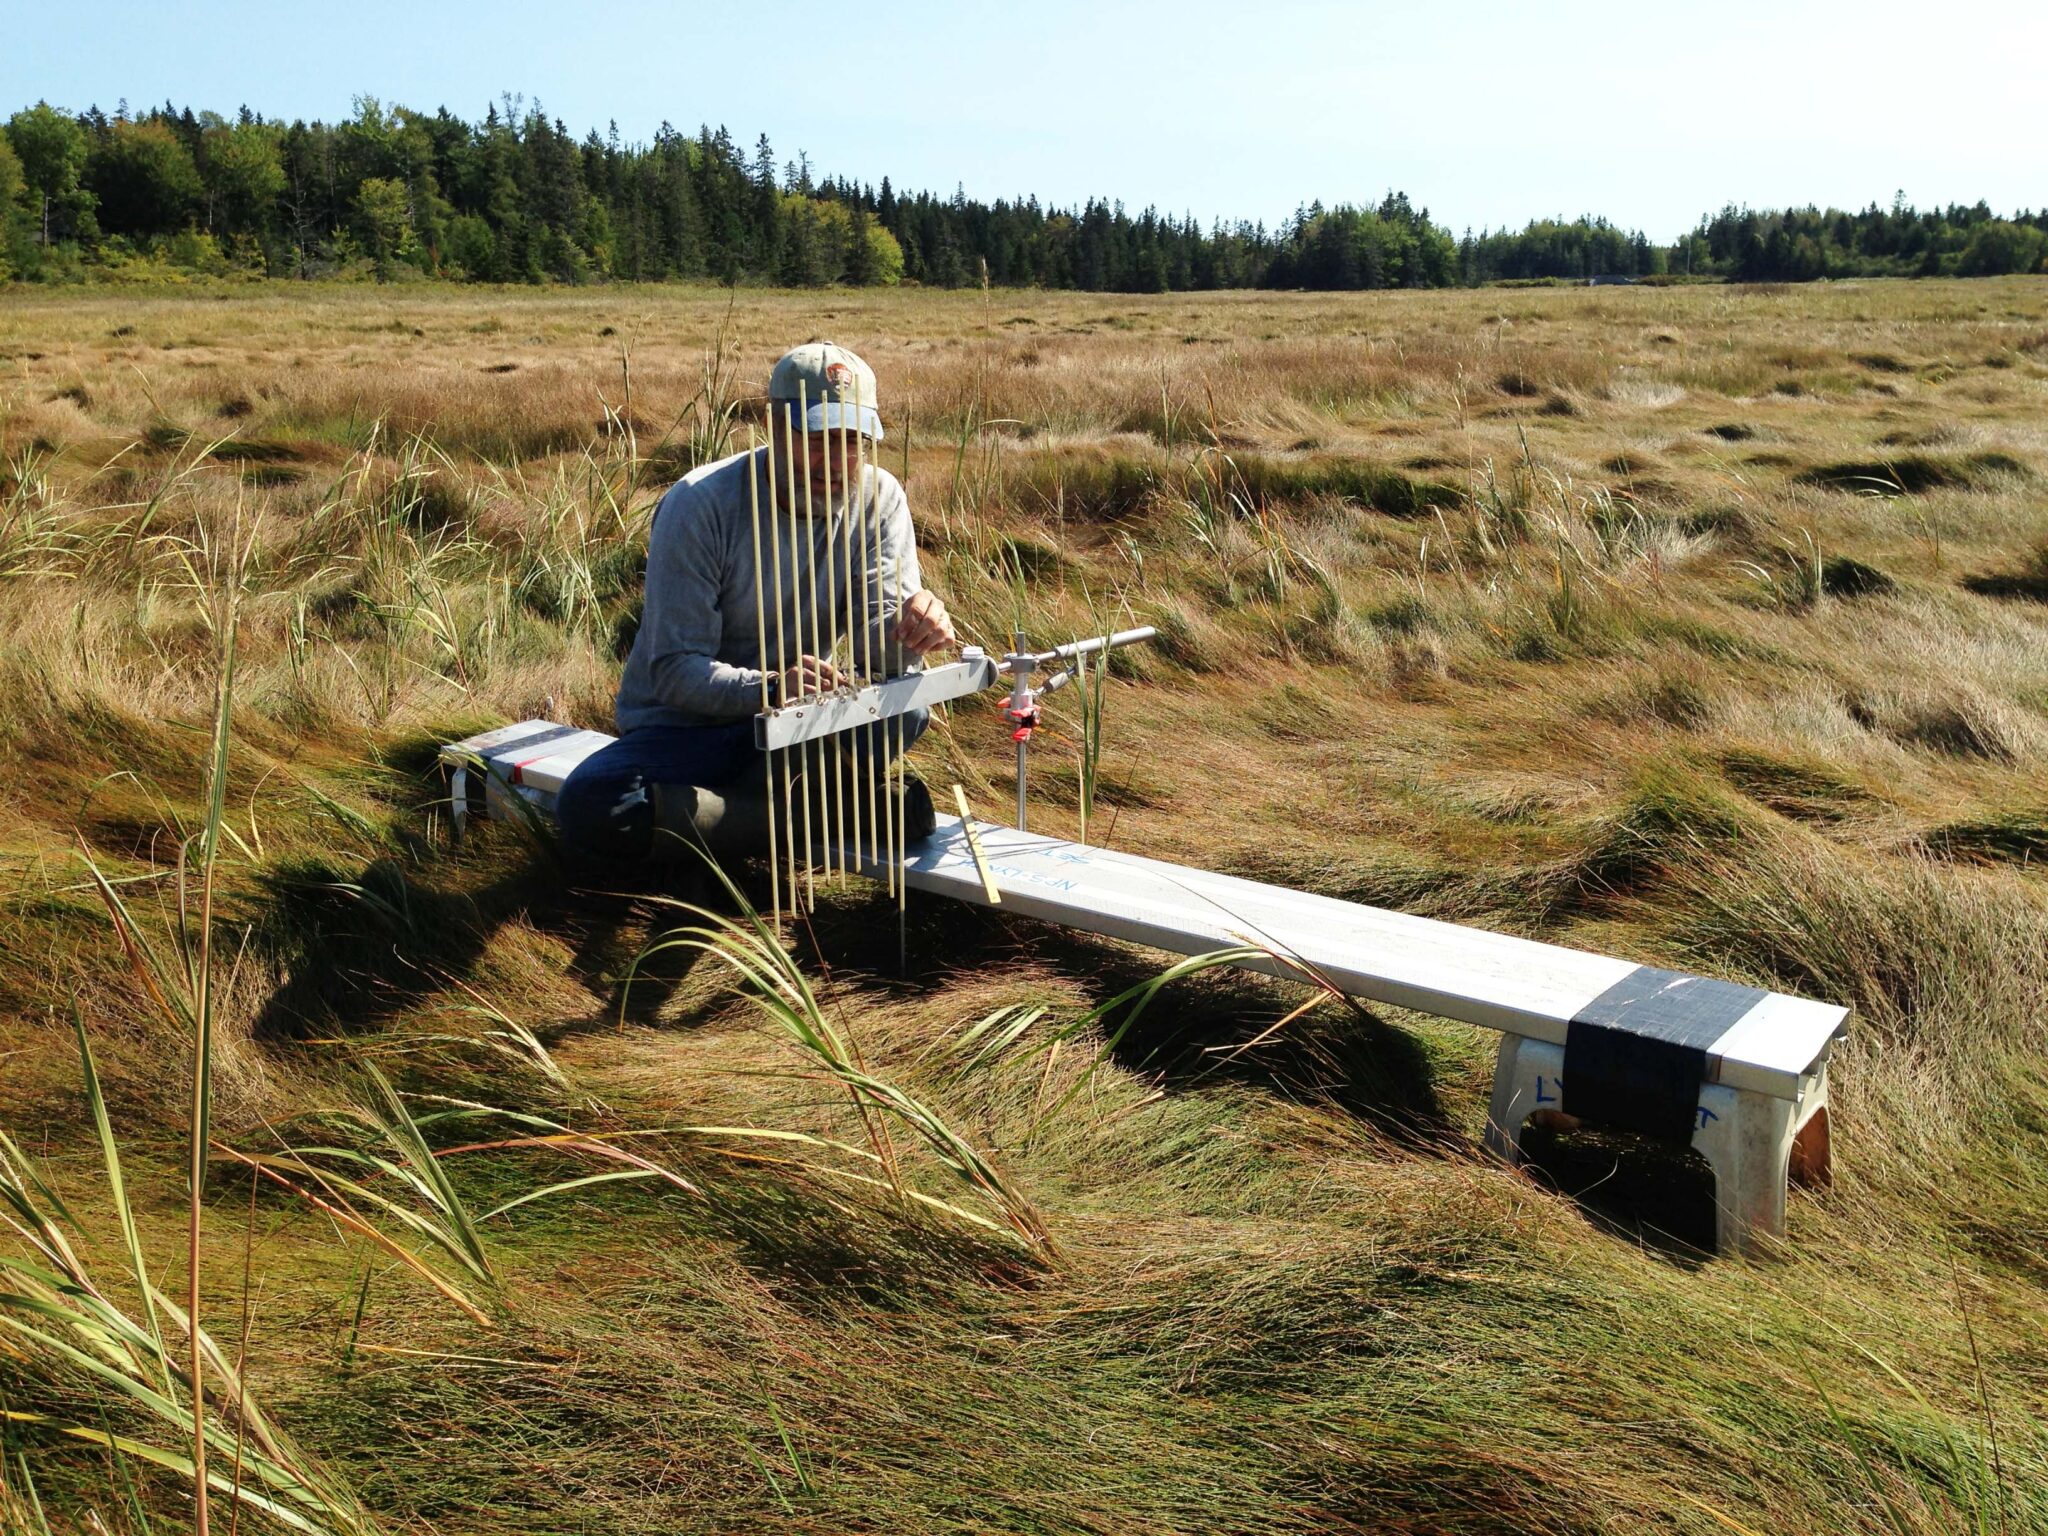
Jim Lynch, a biologist with the National Park Service Northeast Coastal and Barrier Network, has been monitoring salt marsh elevation in Acadia since 2011 with an instrument called the Surface Elevation Table (SET). SETs have pins that move up and down with the marsh surface, much like “pinscreen” toys from the 1980s. Twice-yearly measurements of the pin positions provide a record of marsh growth. The four marshes Lynch is monitoring are all growing at rates under two millimeters (0.08 inches) per year. While this is slower than the rate of sea level rise, the marshes in Acadia tend to sit higher on the landscape. “They look in pretty good shape and are not in any imminent danger,” said Lynch. “Although, things are not improving.”
Acadia’s marshes are also relatively small in area, some with tidal flows altered by road crossings, said Lynch. And the steep slopes common along the shoreline prevent marshes from expanding inland. “Can these marshes adapt and maintain themselves? If they don’t, they will get flooded more often,” said Lynch, who co-authored a global study that found while salt marshes around the world have been growing at rates that “keep up” with sea level, increased flooding associated with faster rates of sea level rise compacts sediment, leaving marshes vulnerable to more flooding, erosion, and plant death. Continued monitoring of Acadia’s marshes, said Lynch, will show if and when such a situation might be occurring.
Documenting vulnerability
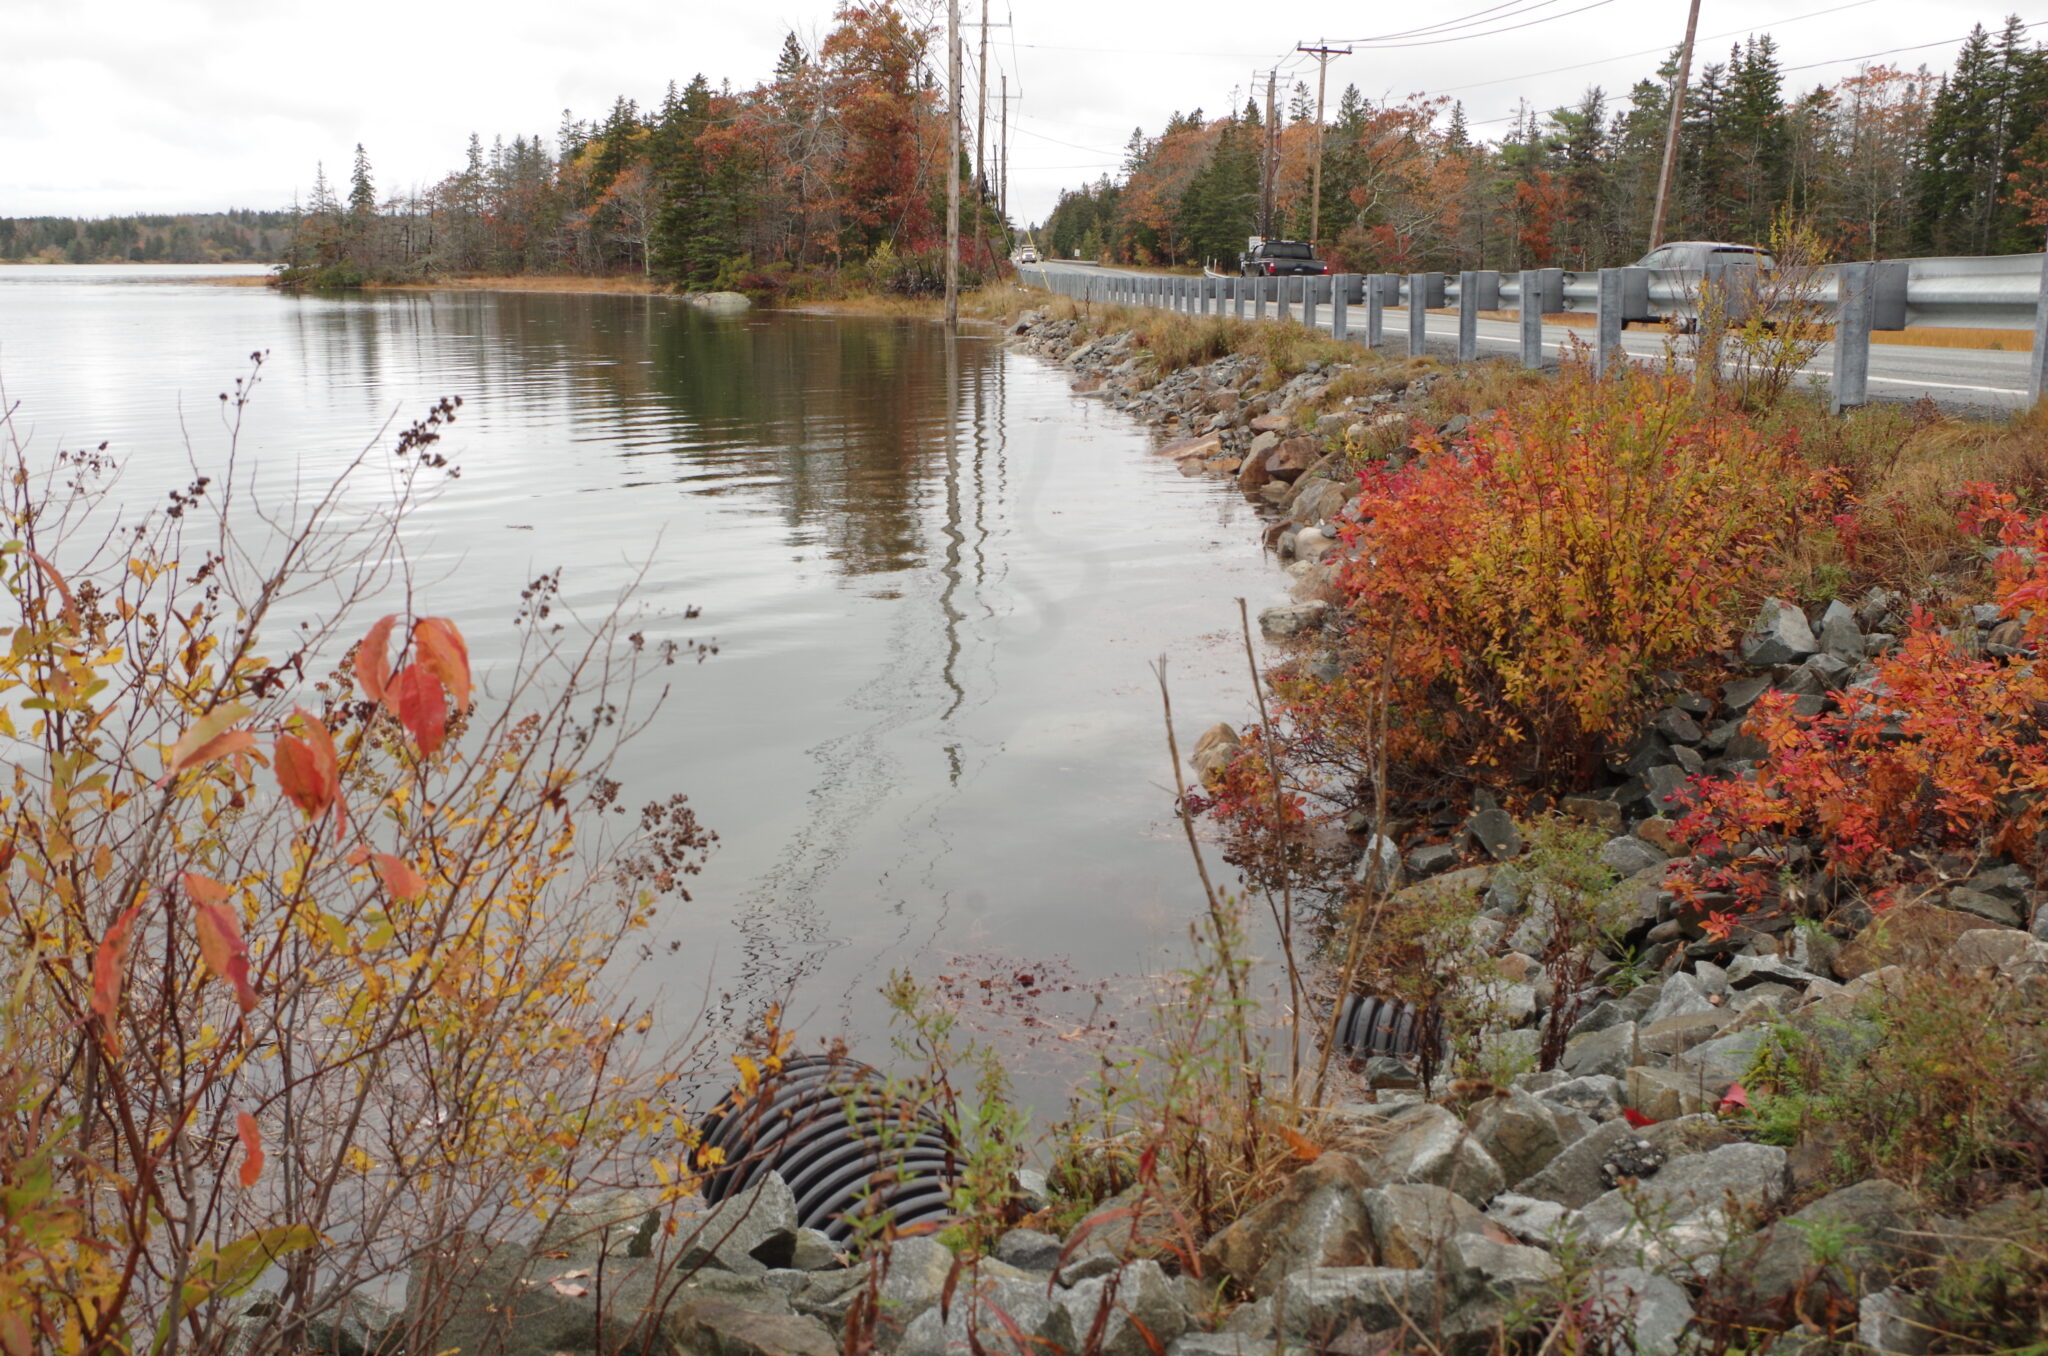
On the Schoodic Peninsula, a recent assessment identified Corea Harbor and numerous roads including Corea Road and Grand Marsh Bay Road as highly vulnerable to sea level rise and storms.
Salt marshes, beaches, roads and other infrastructure, and picnic areas are all places we are watching king tides in and beyond Acadia. You can help by going out at high tide on November 25 & 26 and December 24 and posting photos via Anecdata or by sending to cschmitt@schoodicinstitute.org.
Boston and Cape Cod friends take note: wicked high tides are also coming to your area this week!