by Nick Fisichelli
Acadia National Park includes about 50,000 acres of islands and peninsulas along the coast of Maine, with elevations ranging from sea level to 1,500 feet. In comparison to many other National Park Service units, Acadia is a small park. In fact, you could fit almost 170 Acadias within Wrangell-St. Elias National Park and Preserve in Alaska – the largest unit in the system. As the superintendent there likes to point out, it’s larger than Switzerland and has taller mountains. Yet for its small size, Acadia has large variation in climate driven by proximity to the ocean and range in elevations.
Annual average temperature varies about 2.7 °F (1.5 °C) across the park, according to air temperature sensors we deployed on the Schoodic Peninsula and Mount Desert Island as part of the Tree Test Bed study in 2017. There is even greater variation seasonally, and among minimum and maximum temperatures. The average July daily maximum temperature ranges over 10.6 °F (5.6 °C), with the warmest locations at low elevations in interior Mount Desert Island (~82 °F) and the coolest sites along the shore, especially on southern and western exposures (~72 °F) that receive a cool sea breeze on hot days. This is why we can comfortably swim in the inland freshwater ponds but at Sand Beach, the cold ocean water limits all but the bravest (or foolish?!) from swimming in the Labrador current that swings by Acadia.
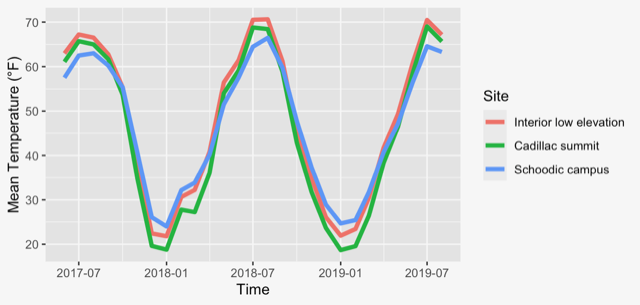
Winter temperatures show a different pattern than summer due to the moderating effect of the ocean. The coldest site is the top of Cadillac Mountain, with a chilly average January daily low of 10 °F (-12. 3 °C). Brrr! Coastal sites are about 7 °F warmer (16.8 F; -8.4 °C). A little less Brrr! In Acadia, average January temperatures vary more (a range of 5.6 °F or 3.1 °C) across a distance of less than 10 miles, than they do between Washington D.C. and Boston, MA (4.5 °F or 2.5 °C) across more than 400 miles.
These climate gradients over short distances in Acadia allow us to research how plants and animals are responding to ongoing climate change and how they may fare under future conditions. We use the warmer sites as proxies for what future conditions might be like at the cooler sites. For example, a summer temperature difference among study sites of 4.7 °F (2.6 °C) is within the range of projected warming over the next several decades and thus provides clues to species responses, such as tree growth and survival. The strong seasonal differences in climate also provide the opportunity to identify which seasons have the strongest impacts on species, e.g., overwinter survival in frigid temperatures and summertime survival of hot and dry conditions.
Warmer temperatures also accelerate biological processes, including photosynthesis by plants and reproduction by insects. There are almost 10 times as many hours per year with temperatures above 77 °F (25 °C) at the interior sites compared with the coastal sites – suggesting major effects to the plants and animals inhabiting these locations.
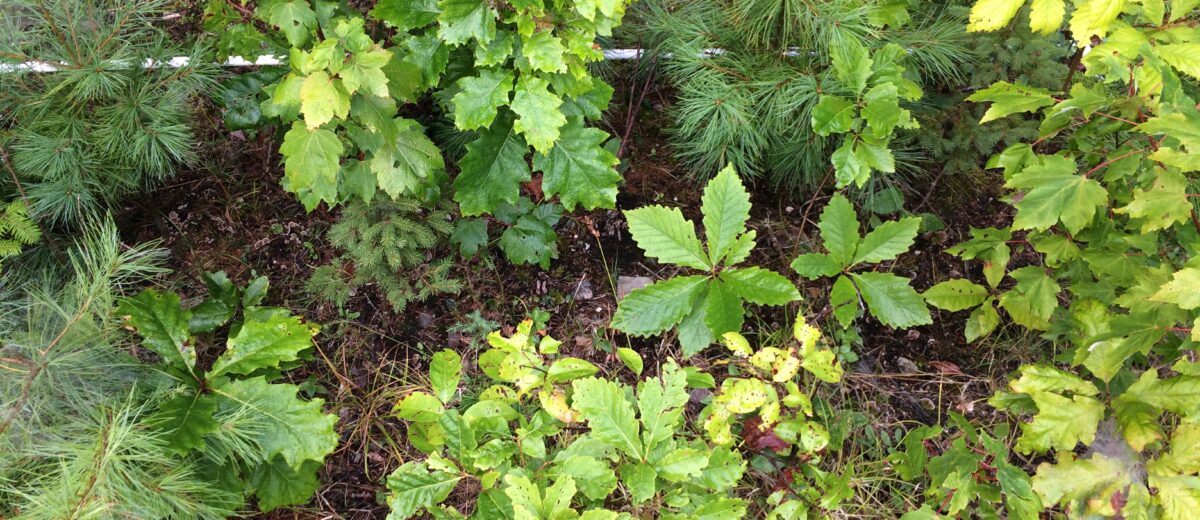
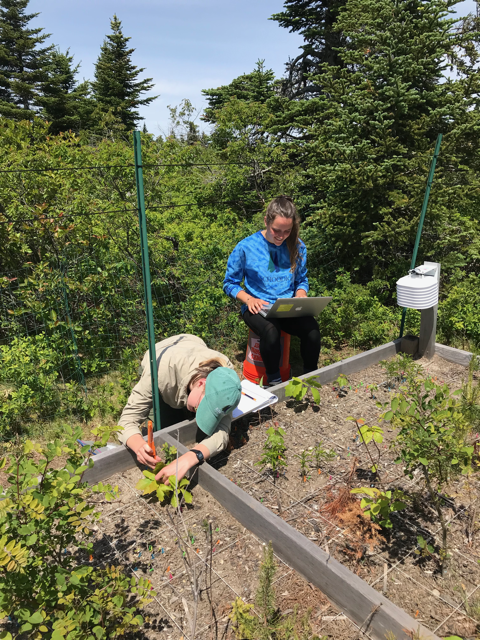
We are currently at the beginning stages of assessing tree sapling performance of 16 species in Tree Test Beds at four sites across the great climate gradient of Acadia. Stay tuned!