by Olivia Milloway
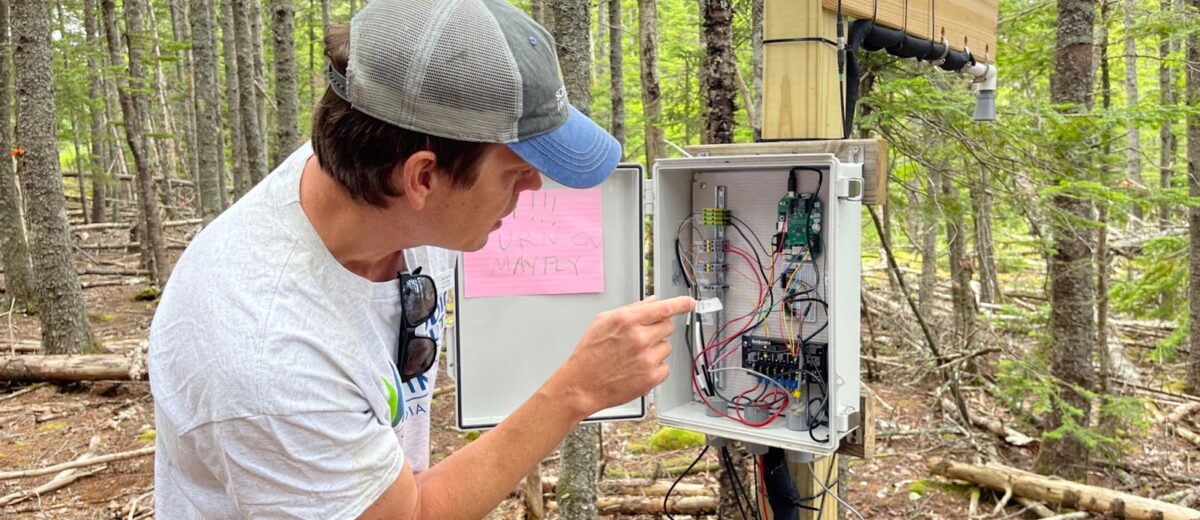
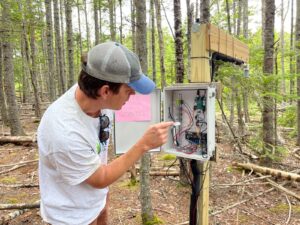
In July of 2021, a group of teachers from Maine, Vermont, and New Hampshire traded in their #2 pencils for a toolbox and took to the forests of Schoodic Institute’s campus. Led by Dr. Elizabeth Burakowski and Dr. Alexandra Contosta, both research faculty at the University of New Hampshire, the educators learned to assemble and install a climate monitoring station—a crucial piece of equipment for understanding climate change’s impact on northern forests.
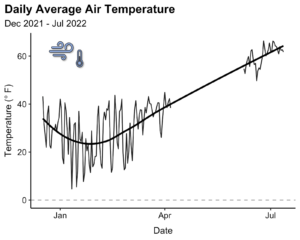
Schoodic Institute’s Forest Ecology Director Dr. Peter Nelson helped facilitate the installation and training and is now responsible for collecting data from the station and performing any necessary maintenance every few months. Nelson intends to use the data–which among other variables include air temperature, humidity, sunlight, and snow depth–to answer questions about the relationship between climate and forests in the Schoodic region.
Nelson is particularly interested in studying the red spruce, a tree that is characteristic of Acadian forests and distinguishes them from boreal forests. Undisturbed Acadian forests, which are exceedingly rare, include a mixture of mature hardwood trees like maples, oaks, and birches, as well as evergreen trees like pines, firs, and spruces. Historically, a combination of cool temperatures and high moisture levels has created a “happy place” for red spruce to thrive on the Schoodic Peninsula. “The climate needs of the red spruce are different than white and black spruce, and the simple story is this is the place in which the red spruce are reaching the optimal growth conditions in terms of climate,” says Nelson.
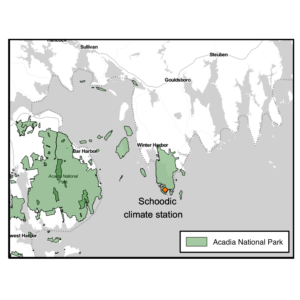
The climate is changing, however. Though red spruce are the most common tree on the Schoodic Peninsula now, Nelson is worried about the future of the forest. Before the installation of the climate station on Schoodic Institute’s campus, the closest weather station was over seventy miles inland in Orono. Schoodic Point was a blank space in the climate monitoring network.
“Fundamentally, without local data, we don’t know the degree, magnitude, or extent of the change,” says Nelson. “To understand the community of organisms we study and educate about, we need to have reliable annual measurements at high resolution that are comparable to other places.”
Furthermore, without a wide range of climate data that are representative of Maine’s coast, modeled climate predictions will not be as useful to Acadia National Park managers who are responsible for areas of intact forest. “Part of the National Park Service’s mission—to preserve and protect—overlaps with the need for monitoring,” said Nelson. “If we don’t monitor, we don’t have an understanding of what we have to preserve and protect.”
Besides showing how the climate is changing along the coast of Maine, the data collected by the climate monitoring station will help Nelson understand the health of Acadian forests. “Warm, wet winters and cool, wet summers—and specifically fog—are prominent features of the coast of Maine. Changes in those things will really influence both human experience and the lives of the organisms that live here,” he explained. The fate of red spruce in the Schoodic area is tied to the fate of the climate.
Nelson also considers these new monitoring stations as an important piece of what he calls “Data 2.0”. “Data 2.0 uses multiple types of data, taken from a network of sensors at different temporal and spatial scales, to answer integrative questions,” he said, adding that these data should be incorporated with human observations, either from citizen science projects or Schoodic Institute’s ongoing biodiversity monitoring projects, to answer questions about the landscape as a whole. “How are you going to make sense of migrating birds if you don’t know what the trees are doing? And how are you going to make sense of what the trees are doing if you don’t know what the climate is doing at the scale at which these animals are moving, which is thousands of miles?”
The monitoring station, which can be seen from one of the paved trails on Schoodic Institute’s campus, is one of ten climate stations established as part of a larger project of the New England Sustainability Consortium. The project is led by University of New Hampshire, University of Vermont, and University of Maine, and at least five more monitoring stations are planned to be installed in the next year. The project, called “Leveraging Intelligent Informatics and Smart Data for Improved Understanding of Northern Forest Ecosystem Resiliency (INSPIRES), is funded by the National Science Foundation. Dr. Sara Lindsay and Dr. Franziska Peterson of the University of Maine, along with Dr. Regina Toolin of the University of Vermont led the educator workshop at Schoodic Institute.
While the research questions of the project are broad, the weather stations fulfill two narrower goals. First, the stations help track seasonal trends in the 26-million-acre Northern Forest Region. When integrated into the network of other sensors, data from Schoodic Institute’s monitoring station will fill in a question mark on a map of the region’s climate. Second, the installation provided an opportunity to train educators from across the region so they can return to their institutions and install their own monitoring stations in order to engage students in collecting their own data. Since the training, four teachers are in the process of installing climate sensors at their own schools, and one Vermont teacher has successfully installed a sensor.
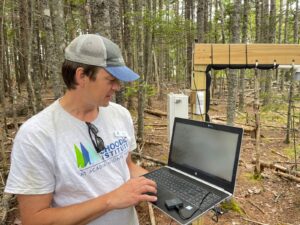
The station collects data every half hour and in the future will be accessible online. Nelson will be reporting on the climate station data as part of future research projects and regular reports on the Schoodic Institute website.