by Sarah Hooper and Bill Zoellick
Schools in Maine shut down at the start of the third week of March. They will not reopen before the end of this school year. When the schools shut down, we were working with Sumner Memorial High School (SMHS) Pathways students on a project that the students need to deliver to the Gouldsboro shellfish committee. Because the work needs to get done whether or not schools are open, the students wanted to continue work through twice-a-week video meetings. This post shares some of what we have learned about project-based learning when the team’s members are all working from home.
Creating a storyboard for the presentation
Managing project-based learning when the quality of the final product really matters depends on making students’ thinking visible. In our experience, “visible” is not just a metaphor, a different way of saying “apparent.” It really means that other students can SEE the different ideas that the group generates and can collaborate in combining them and finding connections and contradictions.
Creating a “storyboard” is a great way to make thinking visible when students are working together to create a presentation. When we worked with Pathways students last year to help them present their findings from clam growth and predation experiments in the summer of 2018, we created a storyboard by taping ideas to a whiteboard in the front of the classroom, moving parts of the presentation around as their thinking changed.
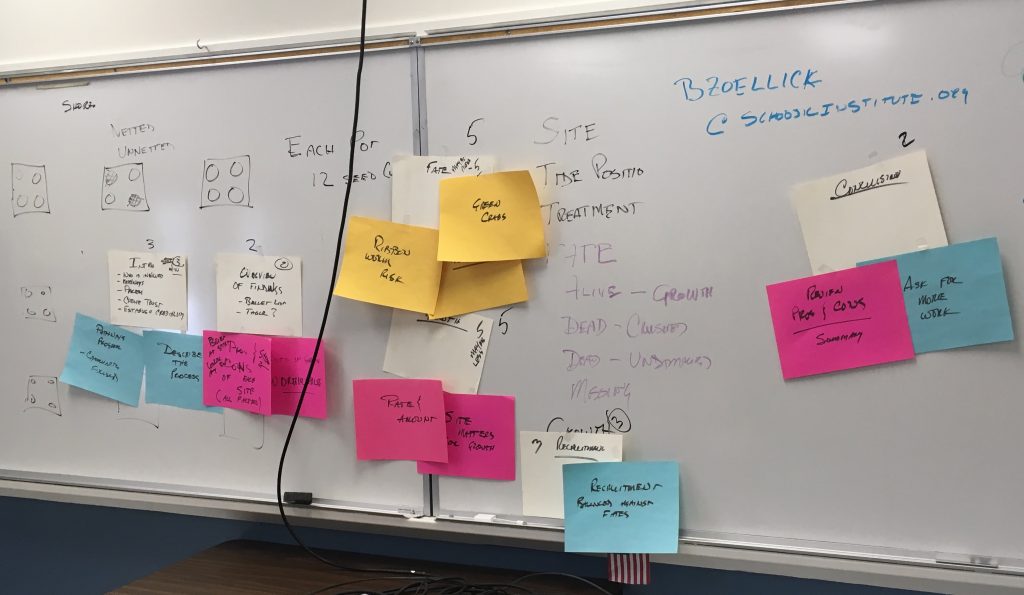
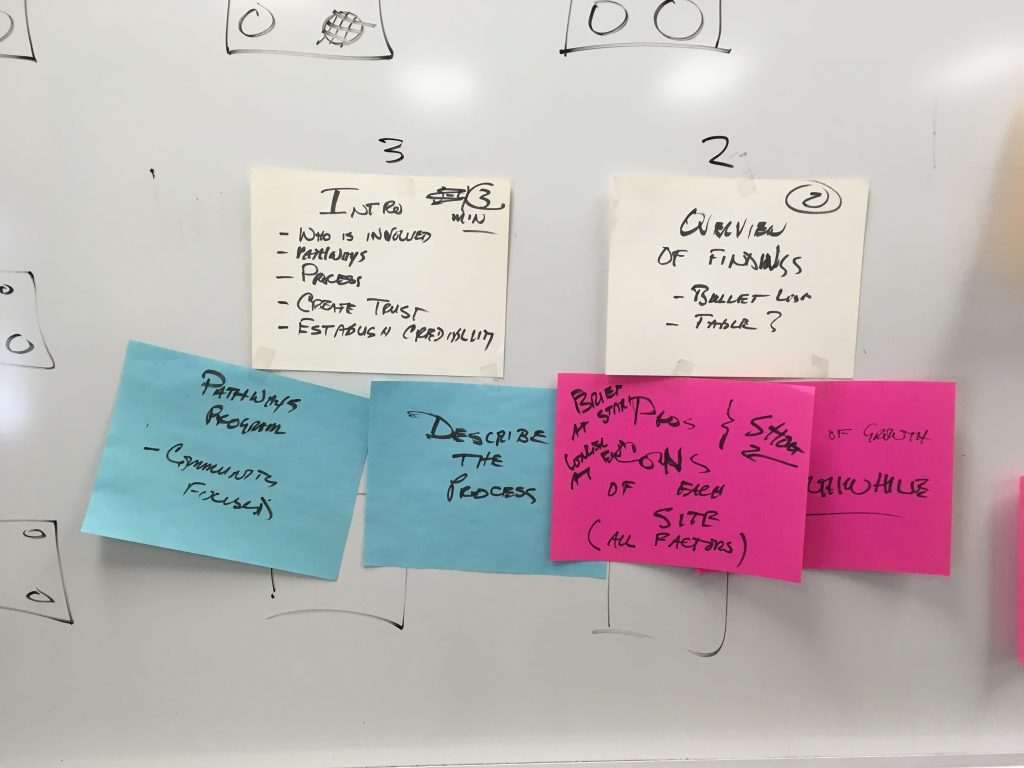
We did this using letter-size sheets of paper, rather than just sticky notes so that we could record more detailed thinking about each of the major elements in the presentation (for example, “Introduction” and “Overview of Findings”) as the discussion continued. The close-up of the whiteboard work that you see below shows how the students’ thinking became more detailed and resulted in breaking the big ideas into parts. For example, they decided that the Introduction should include a description of the SMHS Pathways program, followed by an overview of their findings. As a quick aside, we want to draw your attention to the “Establish Credibility” item in the list. We often find that students are aware of their status as people who do not have full standing as adults when presenting their findings to town committees and other groups. These concerns provide good opportunities to pause and reflect on the quality and importance of the work that they have done and the importance of having data as evidence to support what they have to say.
With school closed, it was clear that we would not be able to gather together to tape ideas to a whiteboard, add new sheets, and move them around. So, we began looking around for a free or inexpensive tool that we could use while we were all hooked up in an online video meeting. We found a web-based collaboration and “mind-mapping” tool called Coggle. Below is a picture of the mind-map that we created last week about how to organize the presentation. Working with Coggle was, in some ways, more fluid than writing things on paper and pasting them to the whiteboard. Being able to capture ideas quickly so that everyone could see them interfered less with the flow of students’ ideas as we talked together. In this case, Bill did the recording as students talked, asking them, “Is that what you meant?” “Did I add this in the right place?” and so on. Since Coggle is set up to support real-time collaboration, it is also possible for students to add things and move them around. This time, Bill served as the recorder to keep the focus on the ideas rather than on using Coggle. But that won’t always be the case. We plan to move toward asking students to capture their own thoughts on Coggle between our video sessions.
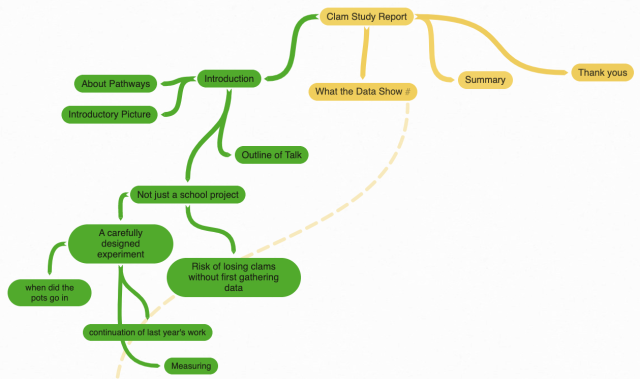
The work in green, on the left, captures the decisions that students made last week about how to get the presentation started. They are still working on getting their hands around the idea that this will NOT be a presentation where they will actually be there to answer questions. Instead, they need to think right now about the questions that the shellfish committee will have about how the work was done, where it was done, the design of the experiment, and so on.
The yellow dotted line that extends down from the item labeled “What the Data Show” is a link to another part of the diagram where we placed images of all the graphs that the students created before the schools closed down. Right now, the students are working on improving those slides. Over the next week or so, we will use Coggle to rearrange the sequence of the images according to the students thinking. When we do that work, we will put little images of all the slides up on the Coggle screen. Working collaboratively online, the students will decide how they want to sequence all of the graphs.
Bill is now in the process of making a video about our experiences using Coggle. He will post it on a new website that we are working on with a network of Maine-based partner organizations. The site is called Community Learning for ME, and the video will be on the “Science in Maine Communities” page in the “Teachers” section of the site. If you are interested in learning more about Coggle, check for the video later this week.
Making a video presentation
One of the BIG challenges that the entire team will face over the coming weeks will be figuring out how to assemble a presentation that can be delivered to members of the Gouldsboro shellfish committee and select board without anyone being in the same room at the same time. The students have decided that they want to produce a video presentation that integrates speaking, photos, graphs, and more. But, just HOW we will do that is still something we still need to figure out.
Fortunately, we have two big advantages. The first is that one of the students in the class already knows quite a bit about Apple computers and software and already has some ideas about how we can do this. The second is that Vern Campbell, who is the SMHS Pathways teacher whom we work with on this project, has a great-nephew who provides technical support to Apple customers and trains others in the use of Apple software. He will be joining us in our Zoom session next week to show us what is possible and to begin thinking with the students about how to proceed. He will also begin working one-on-one with our on-team expert to develop step-by-step instructions for the rest of us, telling us what we need to do and provide for our parts of the project.
Student response
Participation has been punctual and consistent for most of the students on the team. We meet for an hour twice a week and — truly — the hour flies by. Based on the students’ contributions to our discussions (we are thinking here of how they are on-topic, original, thoughtful, and linked to what others have said) our sense is that they are fully engaged for the whole hour. We laugh together a lot. It feels like a team effort. We don’t know for sure, but it might be that since all of us, teachers and students, are at least a little scared and disoriented by what is going on around us, coming together twice a week to work together on a project feels like a good thing — something valuable.
Last Thursday, as the session was wrapping up at 2 p.m., we asked two of the students if they could take on the task of reworking the graphs that had been done in March. We figured this would take until next Tuesday. By 4 pm that same day, they had completed their first run-through of the graphs and got back to us asking where to send their work so they could get feedback.
Other things we have learned
The two of us generally meet after each session to share our impressions about how things went and what we might do to improve our support for the students’ learning. Here are a couple of observations coming out of those conversations.
The first one concerns the amount of time we spend “checking in” at the start of the session. Even in normal times, meeting in person, we routinely ask students about what they have been doing, how things are going, and so on, but this takes up maybe five to seven minutes at the start of class as students are settling. In these online sessions, where students are often sitting alone in their room at home, we may spend 15-20 minutes catching up, and we do this in ways that are not just one-on-one but involve sharing among the group. It is an easy-going kind of conversation, usually including some laughing together. Doing this seems important.
The second observation concerns wait-time. Giving students time to get their thoughts together is a routine part of what we do. But in this online, distanced setting, waiting for even longer than we usually do has often resulted in really thoughtful answers from the students. Maybe this has always been the case, and we should have been waiting longer when we met in person. But we also suspect that everything changes when students are not able to pick up on the body language and other dynamics of the class as a group. Perhaps being in a physical setting where students feel more on their own, coupled with more wait-time, provides a new opportunity for students to find a way to say what they are thinking?
Next steps
The students, Vern, and the two of us have a lot more to do. This week we will continue working together to decide how we want the graphs to look and how to organize them. We will also begin learning about our options for structuring the report as a video, perhaps accompanied by a printable “hand-out” of graphs and bullet points.
Deciding about the organization and “look and feel” of the video will be another opportunity to think and work together. None of us has done this kind of report before. With help from Vern’s great-nephew and our technically knowledgeable student team member, we will all learn a lot.
Our goal is to produce a useful report that represents the students’ work, shaped by what they learn in collaborating with us adults. Finding ways to make students’ thinking visible will continue to be central to making that possible.