by Catherine Schmitt, Science Communication Specialist
This was not unexpected. We’ve been paying close attention to tides, and working with the Mount Desert Island Historical Society and others to illustrate future sea levels. The idea is that by documenting the highest astronomical tides of the year, sometimes called “king tides,” we can imagine the average tides of the future, identify vulnerable locations, and prepare.
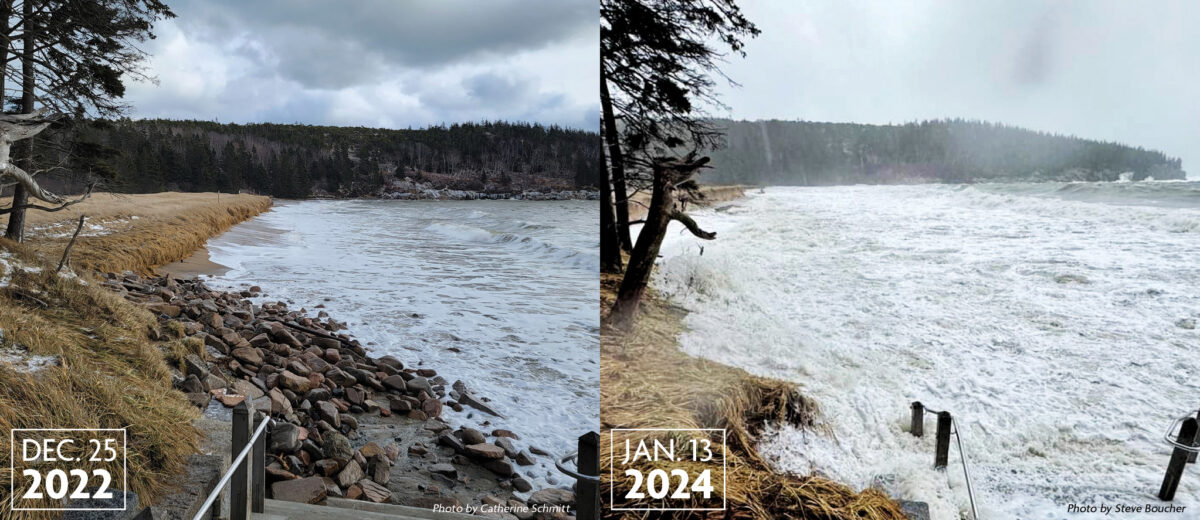
We no longer need to imagine. The storm surge on January 10 raised the height of the sea four feet above the average high tide, or about the level predicted for sea level rise by the year 2100. Suddenly, it seems, the future is here.
But this is not the future we have been preparing for. Our sea level work began with a focus on Nor’easters, the winter storms with northeasterly winds that historically have been the most damaging to Acadia and other coastal parks in the region.
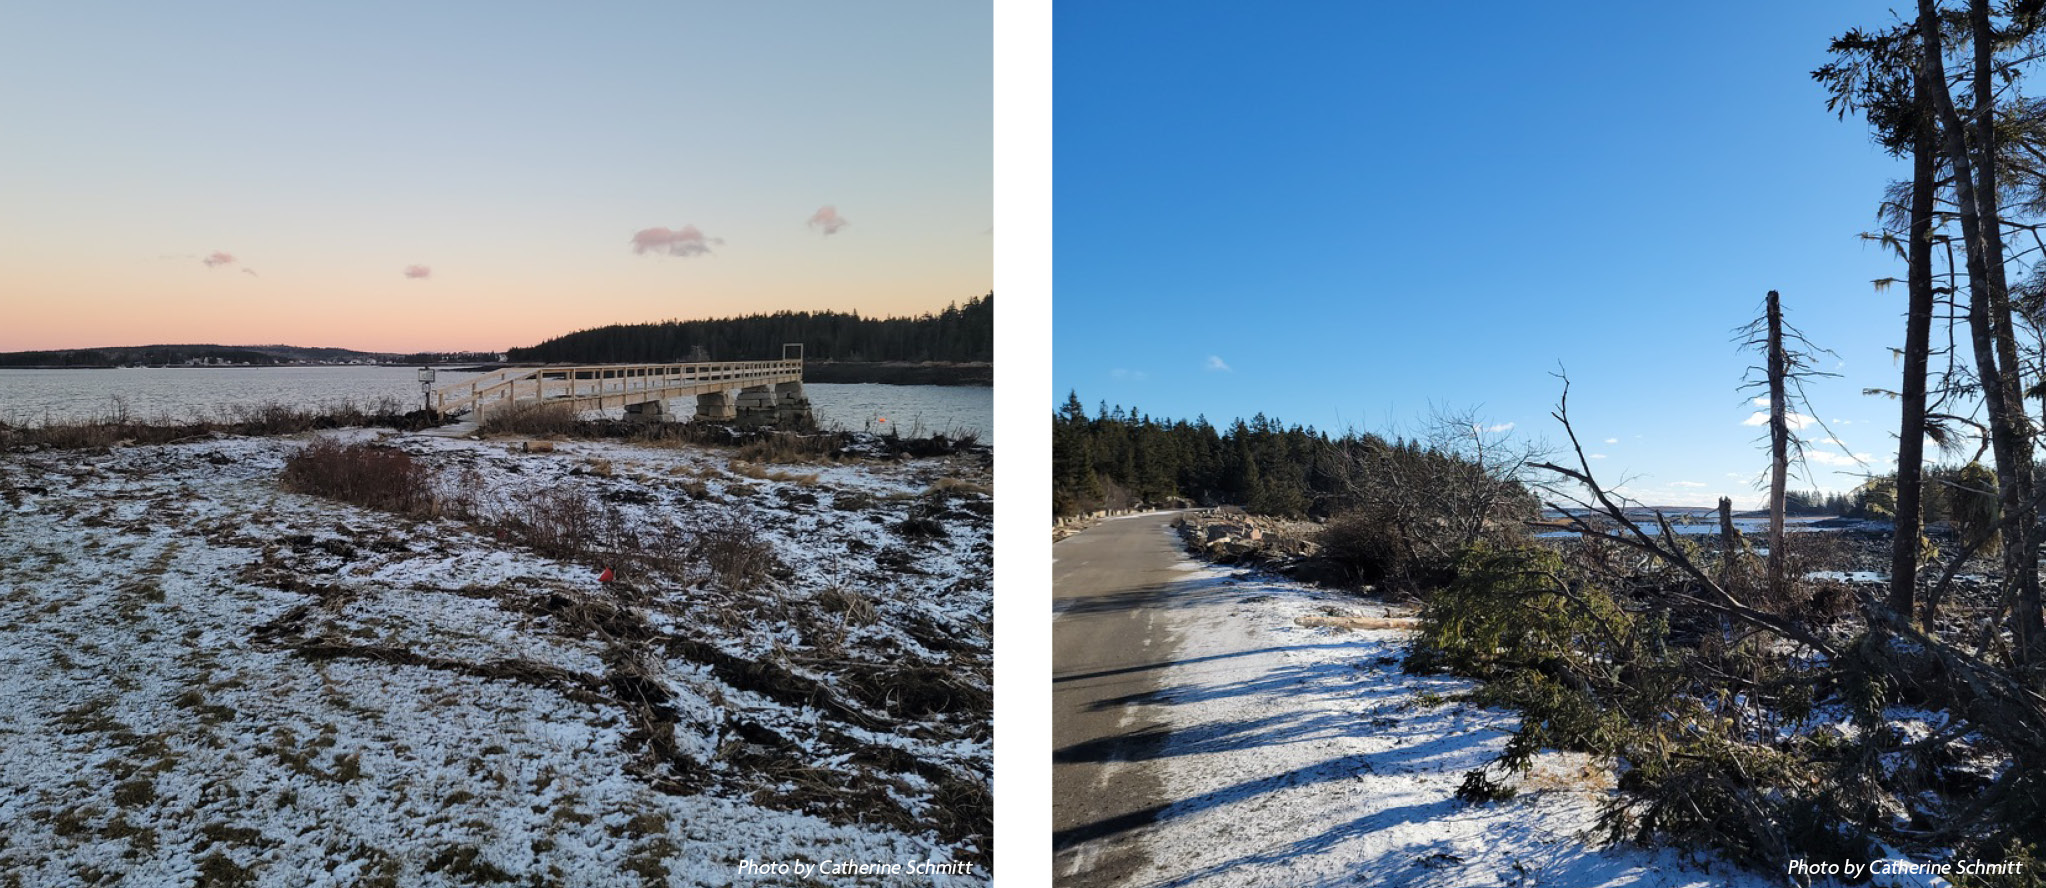
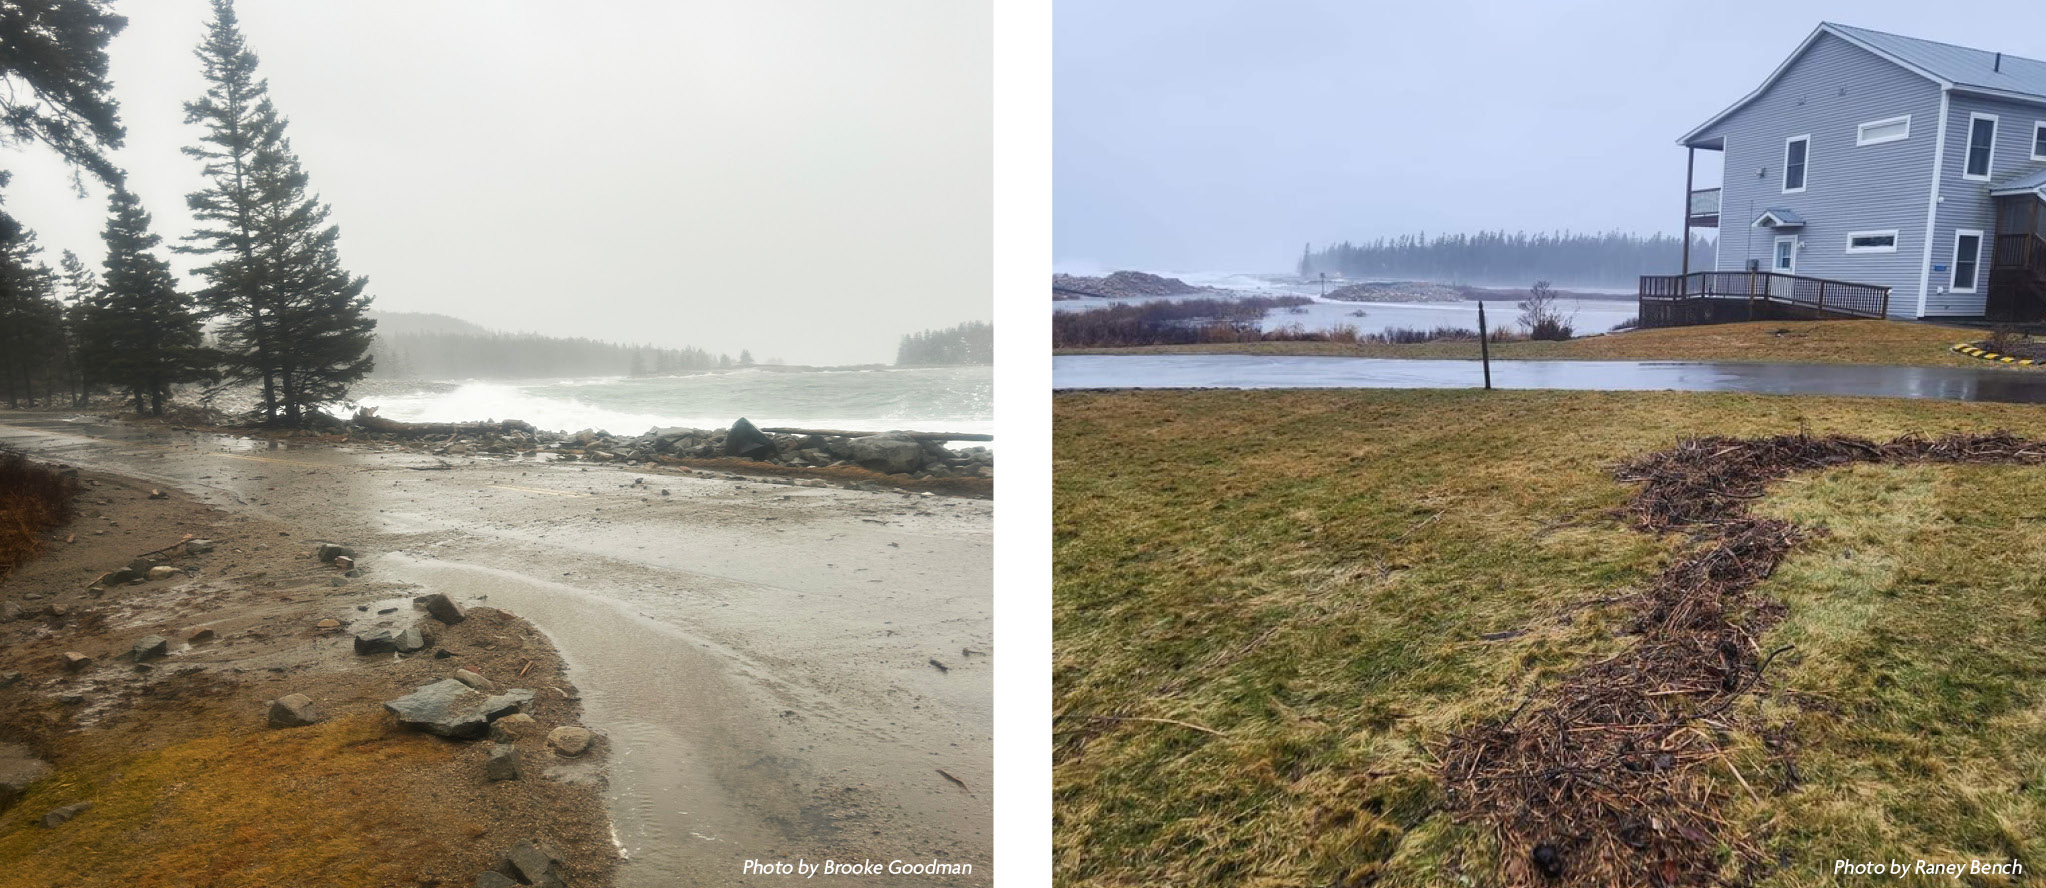
The recent storms, the second of which arrived at the same time as a king tide, had southeasterly winds blowing directly at ocean-facing shorelines. Wind toppled trees and piled water into surging waves that eroded sand and pushed the cobble dunes known as “seawalls” onto roads and into the woods, creating new pathways for water to rush in.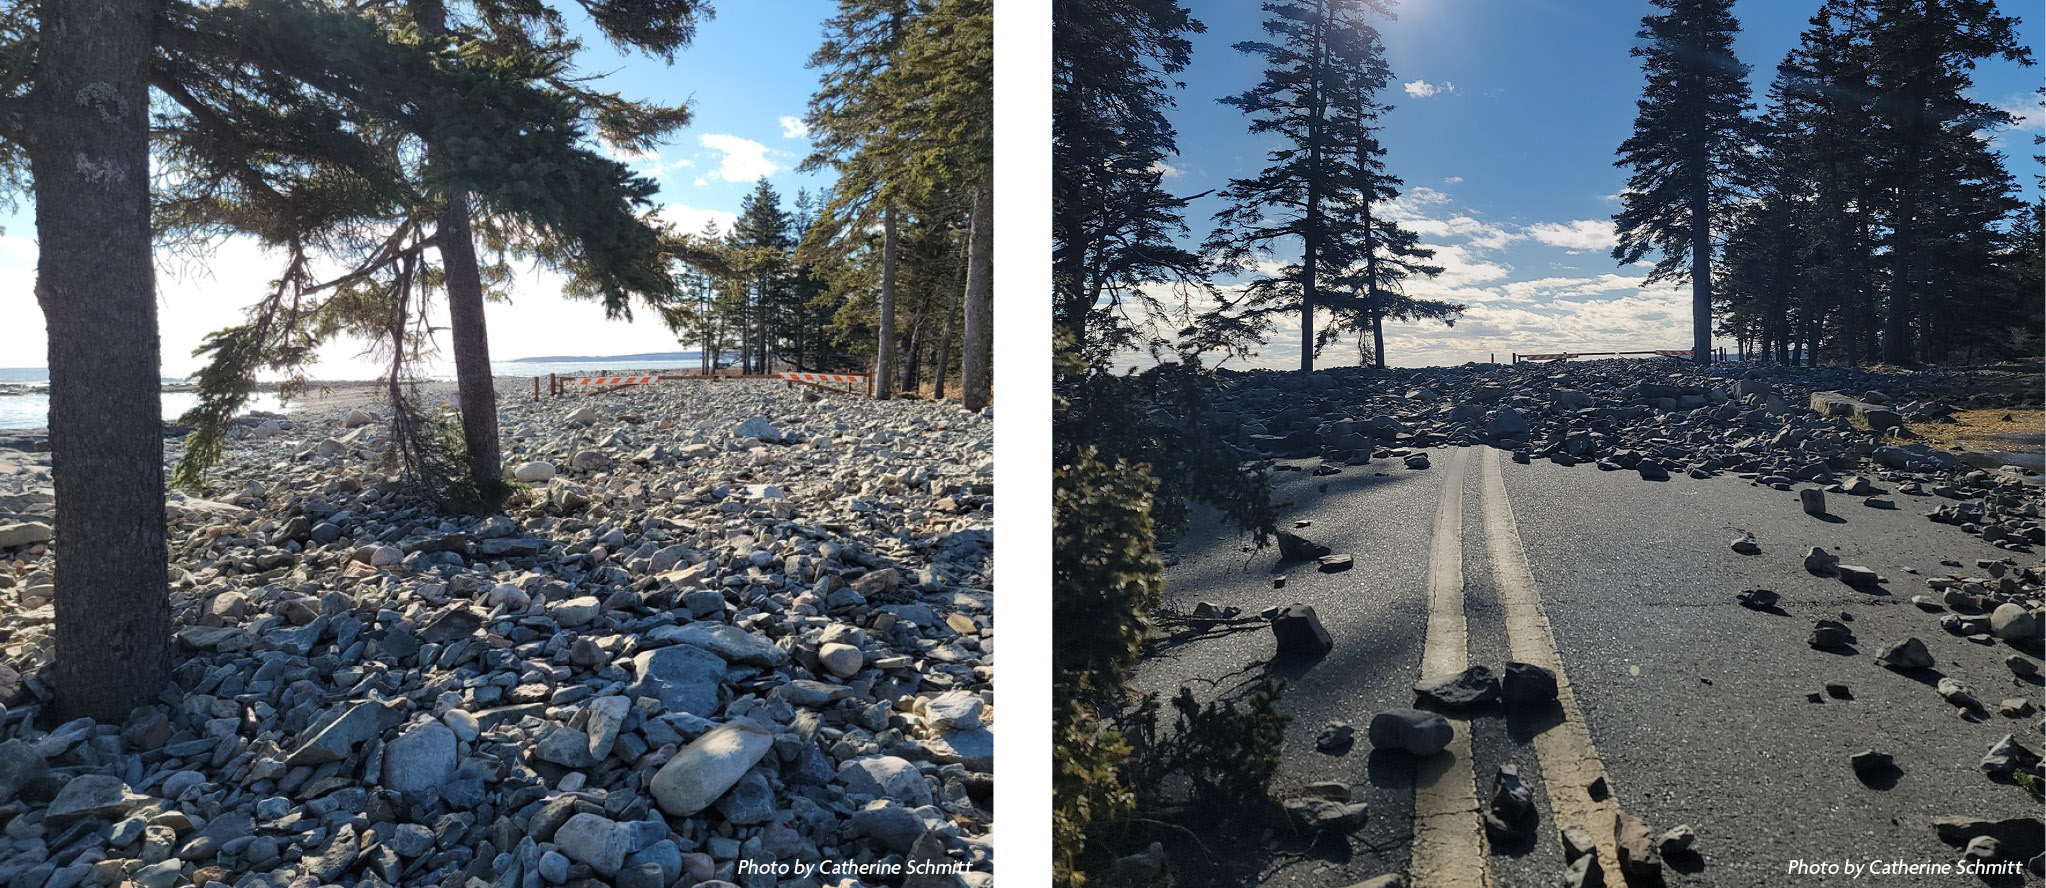
Last week’s storms came in the wake of back-to-back storms in December that brought intense rain, wind, and flooding, all fueled by warmer air and water. Add more frequent and intense storms on top of a higher and more rapidly rising sea and, well, the future is here.
According to Peter Slovinsky of the Maine Geological Survey, mean sea level at Bar Harbor has been trending six to ten inches above the long-term average all year, setting records month after month. In part, this is because tide predictions are based on a 1991 average. “At Bar Harbor, we’ve seen almost six inches of sea level rise since 1991. So this deviation automatically makes the observations slightly higher than the predictions,” said Slovinsky, who noted that NOAA is working on updating their baseline. It also makes the storm surge seem greater than reality.
However, mean sea levels have been trending especially high in 2023, a phenomenon known as a “sea level anomaly.” A similar anomaly last occurred in 2010. Then, sea levels were elevated all along the East Coast, and especially in the Gulf of Maine, and were eventually attributed to a combination of a slower Gulf Stream and atmospheric pressure systems that caused a steady of flow of onshore winds, piling water toward the coast and setting up conditions for consecutive Nor’easters.
The current pattern is different, and the cause is still unclear.
What is clear is a pattern of unpredictable and consequential weather. By repeatedly overwhelming waterways, flooding low-lying areas, re-shaping the shoreline, and uprooting trees, these storms have changed Acadia, a place that was originally protected so it wouldn’t change. Today, the National Park Service recognizes that natural processes and species are evolving, and management policies allow for this ongoing change.
Staff at Acadia are still assessing the damage. Recovery will take months, and likely years.
In the meantime, because it is protected, Acadia is a place where we can study change, learning lessons that can be applied well beyond park boundaries. With Friends of Acadia, we are helping the National Park Service make decisions about whether and how to resist, accept, or direct the impacts of the next storm. Sea level data are informing models of potential response actions, which are in development by researchers at University of Rhode Island. We are collaborating with the park and partners to understand and monitor the health of Acadia’s intertidal zone.
And illustrating king tides and flood heights with the Mount Desert Island Historical Society and other community partners is inspiring conversations about how to live in a landscape of change. Because it won’t be long until the record-high water levels of the future are here again: the next king tide arrives February 10-12, 2024.
If you took photographs during or after the storm that show the extent of flooding, consider posting them to the Gulf of Maine King Tides Project or email them to the Mount Desert Island Society, lisa.murray@mdihistory.org.
More information:
Sea Level Rise Dashboard from Maine Geological Survey
Water Level at Bar Harbor and Storm Peak Water Levels for the East Coast
Coastal Flooding Summary from the National Weather Service
More on storm impacts on the Schoodic Peninsula via Gouldsboro Shore