by Catherine Schmitt
Two new reports on local climate change have been released, adding new details to where our current path leads to Acadia’s future.
The NPS Climate Change Response Program developed a series of park-specific climate futures summaries, describing both observed climate changes and plausible climate futures to help inform park responses. Meanwhile, the Scientific and Technical Subcommittee of the Maine Climate Council released an updated assessment of climate change and its effects statewide.
These new sources of information help update and refine what we know about Acadia’s changing climate, readjusting our communications and decisions about whether and how to resist, accept, or direct change.
As we’ve learned from our work on sea level rise, the challenge is that new records continue to be set that alter our previous interpretations. For example, the State of Maine experienced:
- The driest growing season in 2020.
- The warmest sea surface temperature in 2021.
- The warmest “water year” from October 2022 to September 2023.
- The wettest summer in 2023.
- The highest sea levels in 2024.
Our Landscape of Change calculations from 2021, by Maine State Climatologist Sean Birkel, used the same source as NPS (NOAA NClimGrid) but instead extracted data for the Coastal Climate Division of Maine and Bar Harbor, and focused on the increase in annual average temperature 1895-2020, which was 3.4 °F on a linear trendline. However, all three years since then – 2021, 2022, and 2023 – ranked among the top-five warmest. As a result, the updated increase in annual average temperature 1895-2023 in the Coastal Climate Division, which has more complete data and closely tracks Bar Harbor, is 3.9 °F, shown in this updated figure from Dr. Birkel: 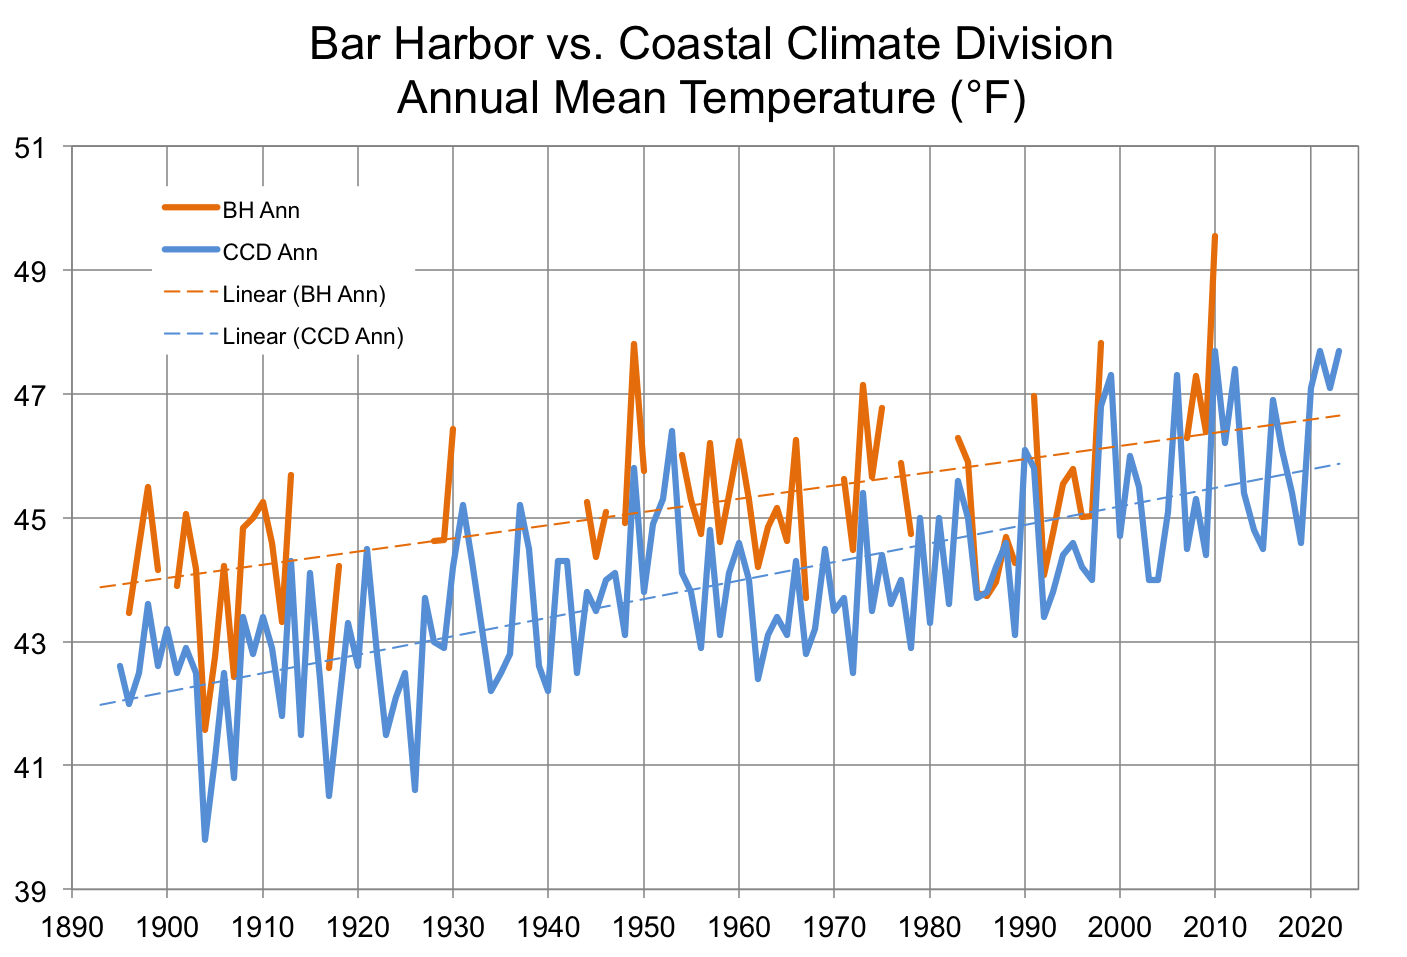
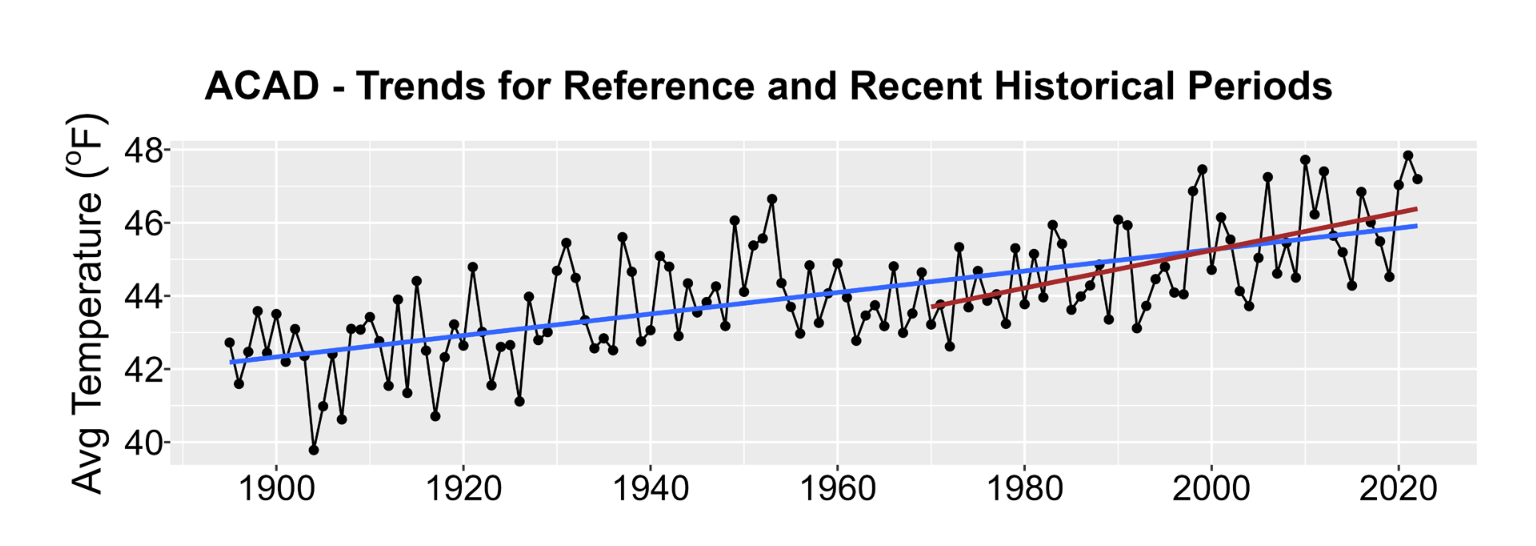
All climate models project significant warming by 2050 with projected increases in average annual temperature ranging from +2 °F to +8.2 °F. But here again, we’ve already experienced some of this warming – at least half a degree just in the last three years. This may be why the NPS report focused so much on the rate of warming (the journey) and not the final increase (the destination). The rate of warming in the Acadia region has increased from 2.8 degrees per century between 1895 and 2022, to 5.2 °F per century since 1970.
Extreme temperatures are expected to increase, with an additional 9 days each year exceeding 85.9 °F. Projected changes in precipitation are less clear, with an increase in intense events – as much as 8 or more inches of rain in 24 hours (for reference, the June 2021 storm that washed out bridges, carriage roads, and trails was 4.7 inches).
What is clear is that future conditions will not resemble the past, and planning for more than one plausible future will best position us to respond. Thus, the NPS report identified two plausible, divergent climate futures (“Warm Dry” and “Hot Wet”).
The ultimate destination depends on the choices we make along the way, starting today.
Read the reports:
Acadia Climate Futures, National Park Service
2024 Scientific Assessment of Climate Change and Its Effects in Maine (Executive Summary) (Full PDF), Maine Climate Council Scientific and Technical Subcommittee